Very few industries have suffered a decline as steep as coal’s. In just five years, the coal industry has gone from relatively healthy to almost entirely bankrupt. Major coal producers – including Peabody Energy, Arch Coal, and Alpha Natural Resources – have filed for Chapter 11 protection over the past year.
The industry’s slide is illustrated by the stock price performance of individual producers. Arch Coal’s stock, for example, has plunged 99.9% from a reverse split-adjusted high of $346.23 in March 2011 to the current price of $0.37. Its stock has fallen by high double-digit percentages in each for the last five years.
There are four causes of the industry’s misfortune: the decline in the price of natural gas, the rise in the value of the dollar, the industry’s response to the Environmental Protection Agency’s (EPA’s) Mercury and Air Toxic Standards (MATS) and most recently, the exceptionally warm winter weather.
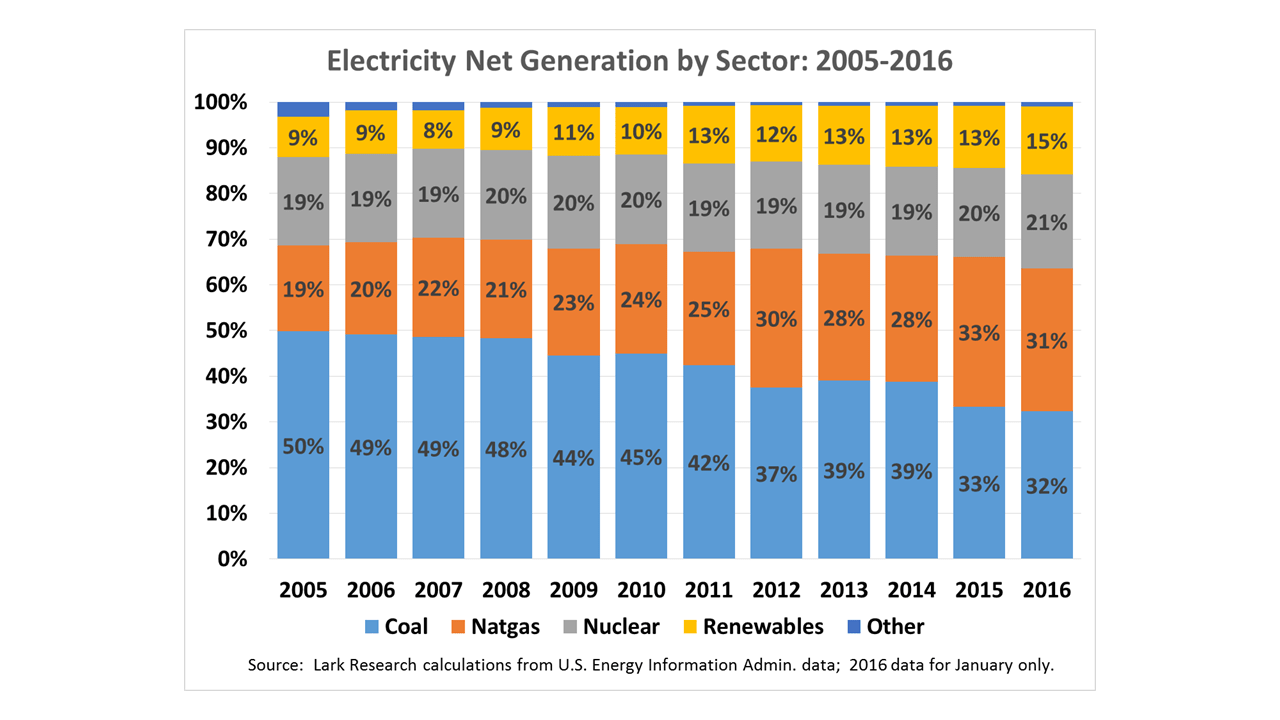
The primary catalyst for the industry’s downturn has been the low cost of natural gas. Thermally efficient natural gas fired power plants are now the lowest cost producers of electricity. With little growth in electricity demand and excess generating capacity, gas-fired plants have replaced coal in the generation mix. As shown in the chart below, their share of total electricity generation has risen steadily from 19% in 2005 to 33% in 2015; while coal’s has dropped from 50% to 33%.
Another key factor in the coal industry’s downfall has been the retirement of coal-fired capacity due to the adoption of EPA’s MATS. Rather than incur the high cost of updating older (and mostly smaller) plants, the industry has chosen to retire an estimated 60GW of coal-fired capacity between 2012 and 2020. SourceWatch.org has compiled a list that shows 60.8 GW of completed and planned retirements from 2012 to 2020, with nearly 40GW scheduled to be completed through 2015.
EIA historical data on coal-fired plant capacity and related retirements and additions are available only through 2013. For the periods beyond 2013, an estimate of total capacity can be derived from the EIA’s data on electricity production and capacity factors. (The EIA has been publishing monthly capacity utilization data since 2013.) The coal-fired capacity estimates derived from EIA follow a track that is generally consistent with the retirement schedule published by SourceWatch.
With the schedule of plant retirements from SourceWatch and a 2012 base of 310 gigawatts (GW), I estimate that total coal-fired power plant capacity declined by 2.2% in 2013 and 2.0% in 2014 and then by about 6% in 2015. The biggest year for retirements was 2015, the year that MATS went into effect, when a total of 17.6 GW of capacity was set to close. Another 9.1 GW of coal-fired capacity is scheduled to close in 2016, according to the SourceWatch list, and 5.4 GW in 2017. After that, the closures taper off. The EIA’s analysis anticipates that nearly all of the 60 GW of retirements will be completed by the end of 2016..
Scheduled coal-fired plant closures almost certainly do not anticipate the adoption of the EPA’s Clean Power Plan (CPP). Its proposed state-by-state limits on greenhouse gases will go into effect in 2020, as long as the EPA is able to withstand both current court challenges and changes that may be made, if a Republican is elected in November.
In this year’s Annual Energy Outlook, the EIA includes for the first time the impact of CPP implementation in its Reference (or base) case. Not surprisingly, its projections show a steady decline in coal consumption during the forecast period (to 2040).
In prior AEOs, the EIA had assumed that rising natural gas prices would cause coal consumption to bottom out in 2016, recover modestly through 2030 and then remain steady until 2040. But those projections will change when the 2016 AEO is released probably in June. An early release summary of the 2016 AEO and a detailed study of the impact of the CPP are available now on the EIA’s website.
Using EIA’s capacity factor data, I estimate that coal-fired capacity declined by 4.1% in 2015. Yet, the total amount of electricity generated from coal in that year fell by 14.3%. Plant retirements and the continuing shift toward natural gas-fired production were major causes of the 2015 decline, but weather also had an impact. This is perhaps best illustrated by looking at the year-over-year change in electricity net generation by sector for the 2015 fourth quarter and January 2016 as shown in the chart below: (Data for February 2016 and beyond is not yet available.)

Coal-fired electricity generation declined by nearly 23% or about 80 billion kilowatt hours (kWh) in the 2015 fourth quarter. Add to that nuclear power’s 10 billion kWh slide for a total decline of 90 billion kWh. Partially offsetting this decline was the increase of 59 billion kWh in natural gas-fired and renewables production. So the difference of roughly 30 billion kWh, which equals the decline in total electricity production, was due mostly to the warm weather. Thus, I estimate that about one-third of the decline in 2015 fourth quarter coal-fired generation was due to seasonal factors.
This seasonal trend undoubtedly continued into 2016. It would not be surprising to me if the warm weather accounted for four percentage points or more of the 14.3% drop in coal-fired electricity net generation in 2015 and a similar amount in early 2016. Consequently, coal demand will probably get a modest boost from a return to normal winter weather in the 2016-2017 winter season.

The fourth and final factor in coal’s recent demise has been the rise in the value of the dollar. Dollar strength has taken a big bite out of U.S. coal exports. To be sure, other factors are at play here too, including reduced demand for steel in China, increasing coal production capacity outside the U.S. and the high relative cost of transporting U.S. coal to overseas end markets.
In recent years, exports of both steam coal (used to generate electricity) and metallurgical coal (used in the production of steel) have helped to offset some of the slide in domestic coal consumption. However, exports peaked in 2012 and have been falling at a double-digit rate in recent years, as shown in the chart below:

Putting it all together. The confluence of events – the loss of market share to natural gas-fired plants, the implementation of the EPA’s MATS rules, the sharp decline in exports and drop in demand from unusually warm winter weather – caused coal production to fall again in 2015, by 10% to below 900 million short tons, the lowest level since the 1970s.

Coal production would have fallen further, were it not for a build-up in coal stocks (i.e. inventories) of 45.0 million short tons to a record 242.8 million short tons at the end of 2015.

Working off that excess inventory will take time. In its most recent Short-Term Energy Outlook (STEO) report (May 2016), the EIA projects that coal production will fall 17% to about 745 million short tons in 2016. It also assumes that coal consumed in electricity production will fall 8% in 2016, but increase by 4% in 2014. Finally, the EIA anticipates to U.S. coal exports will drop by 20% in 2016 and by another 4% in 2017.
In the table below, I utilize the EIA’s primary assumptions, as given in the preceding paragraph, to come up with a comprehensive view of the outlook for coal production, consumption and stocks in 2016 and 2017:

Using EIA’s primary assumptions – the 8% decline in coal used for electricity generation, the 20% decline in coal exports and the 17% decline in total coal production – I project that coal stocks should drop by 30 million short tons from a record 242.8 million tons at the end of 2015 to 212.8 million tons in 2016.
For 2017, the EIA has projected a 4% increase in electric power coal usage and another 4% decline in exports, but it has not yet (to my knowledge) provided an overall production forecast for 2017. With my assumption that coal stocks will decline by another 20 million short tons, I project that total coal production would increase by 5.1% to 782.4 million short tons in 2017.
Of course, forecasts are frequently updated to reflect new information. The EIA points out that its projections are not statements about what will happen, but rather what might happen under certain assumptions and forecasting methodologies. With the available data, I have the following observations about the EIA’s latest forecast for the coal market:
- The anticipated 8% decline in coal used for electric power generation seems to lean more heavily on coal’s loss of market share to gas-fired plants and renewables than on the impact of warm winter weather. As noted above, coal consumption for electric power was down nearly 23% in the 2015 fourth quarter and 14% in January 2016. If I am correct that about a third of the decline was due to seasonal factors, the EIA’s assumption seems about right, even though the weather-related portion of the loss in early 2016 should be made up in the fourth quarter, at the beginning of the next winter heating season.
- My estimate applies the EIA’s forecast for exports to total net exports. (It therefore indirectly assumes a comparable percentage drop in coal imports.) More importantly, the forecast implicitly assumes that the dollar remains high. Given that the dollar has declined through most of 2016 and remains below year-end 2015 levels, the EIA’s forecasted decline in exports may be aggressive.
- Based upon sales volume figures reported for the 2016 first quarter by Arch Coal and Peabody Energy, the EIA’s projection of a 17% drop in total coal production for 2016 looks light. Both companies reported year-over-year sales volume declines in excess of 30%. The EIA’s weekly production figures for coal have been down 30% year-over-year for most of 2016. If the assumed drop in electric power consumption of 8% holds true, therefore, it appears that the major producers have cut back production and sales sharply in an effort to bring coal stocks into balance much more quickly than reflected in my projections. If this is correct, 2016 will be a tougher year for the industry than reflected in my forecast, but 2017 should be better than anticipated due to tighter inventories, making a rebound in the average selling price more likely.
- The EIA’s outlook for coal consumption in the electric power sector depends heavily on its forecast for natural gas prices. The higher projected market shares for natural gas-fired plants in 2016 are based upon the assumption that natural gas prices will remain low in 2016. In its May 2016 STEO, the EIA anticipates that the Henry Hub spot price, which averaged $2.62 per million BTUs in 2015, will drop to $2.25 in 2016 before rising to $3.02 in 2017. Higher natural gas prices in 2017 support the projected 4% increase in electric power coal burn in 2017.
Over a longer time horizon (to 2040), the Agency’s base case, as outlined in its 2015 Annual Energy Outlook (AEO), previously anticipated that coal production would rise 7% per year until 2030, due mostly to the rising cost of natural gas, and then remain flat from 2030 to 2040, as coal’s market share in the electric power production mix leveled off. The Agency also projected coal production under a variety of economic and commodity price scenarios. Under its worst case scenario for coal, production would be 13% below its base case scenario for 2030 and 11% below its base case scenario for 2040. In its base case scenario, coal production would remain below the 2008 level of 1.17 billion short tons throughout the forecast period (to 2040). However, the EIA’s projections for the 2015 AEO did not reflect the implementation of the EPA’s rulemaking under its Clean Power Plan
The 2016 Annual Energy Outlook, due out this summer (probably in late June?), does anticipate the implementation of the Clean Power Plan. As already noted, a summary of the major assumptions and conclusions of the report was published on May 17, along with a separate report analyzing the impact of the Clean Power Plan.
According to 2016 AEO summary, electricity demand is expected to grow by 0.9% annually to 2040, but it would be 2% lower than it otherwise would be, due to the anticipated higher cost of electricity under the CPP.
The CPP would also accelerate the shift to low carbon alternatives for power generation. EIA anticipates that coal’s share of the generation mix would fall from about 33% currently to only 18% in 2040 under the CPP. In that case, coal-fired electricity production would drop by 382 billion kWh or 28.4% from 2015 to 2030 (or by 1.7% annually on average); but the steepest decline would occur after 2020, when the CPP rules are scheduled to go into effect.
If the CPP is not implemented, EIA projects a slower decline in coal’s market share to 26% in 2040 and coal-fired electricity production would actually increase to 2030, but only by 67 billion kWh or about 0.3% on average per year.
The CPP still faces considerable hurdles to adoption. A number of states and other interested parties continue to challenge this rulemaking, arguing that Congress did not intend to give the EPA the authority to regulate greenhouse gas emissions under the Clean Air Act. The EPA has won the first few rounds of this fight in the courts, including the Supreme Court, but the opponents remain undaunted and will continue to press for repeal of the CPP right up to the date of adoption, if necessary. A new Republican administration would almost certainly scrap or make significant changes to the CPP.
Based upon this analysis, I believe that it is a pretty easy bet that 2016 will mark the low point for coal production. However, it is difficult at this time to predict how robust its recovery will be. Demand for coal-fired generation ultimately will depend upon the course of natural gas prices and the strength of the economy. Despite their high carbon footprint, coal-fired power plants are a reliable, cost efficient and relatively safe means of generating electricity.
May 24, 2016
Stephen P. Percoco
Lark Research, Inc.
839 Dewitt Street
Linden, New Jersey 07036
(908) 448-2246
incomebuilder@larkresearch.com
©2016 Lark Research, Inc. All rights reserved. Reproduction without permission is prohibited.
Discover more from Lark Research
Subscribe to get the latest posts sent to your email.