24Q4 Results: Treasurys Slightly Outperform TIPS with Both Posting Moderate Losses.
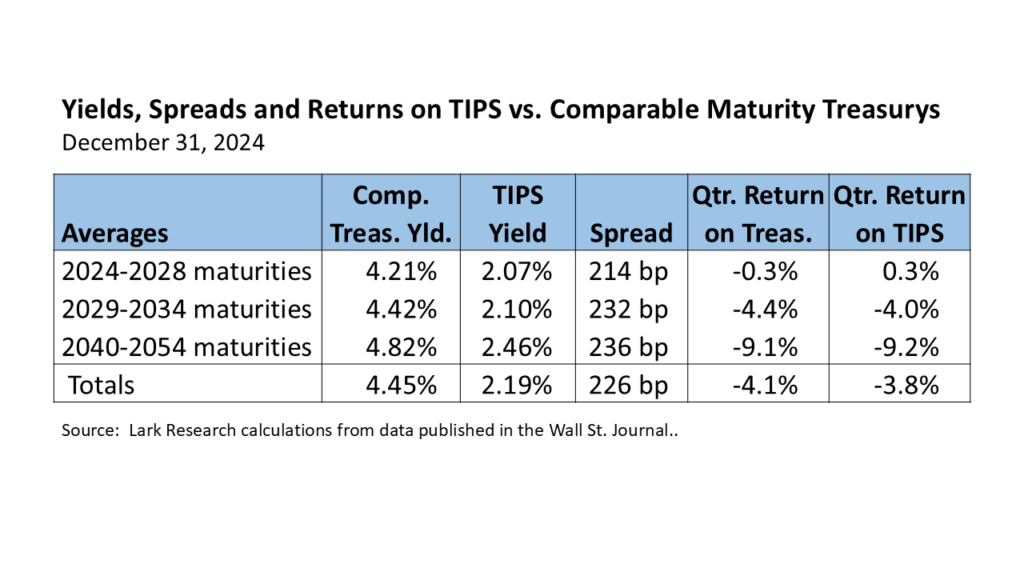
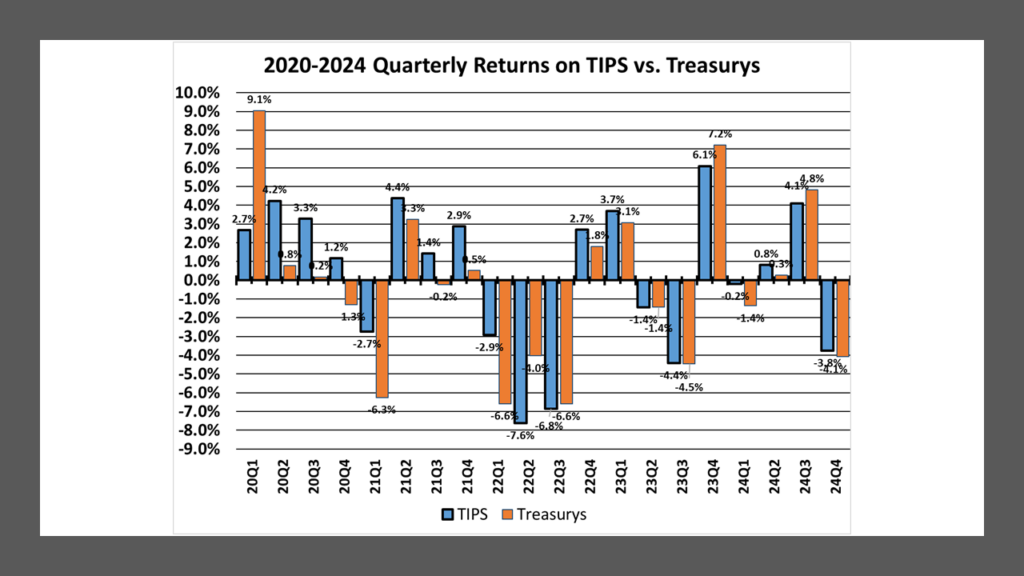
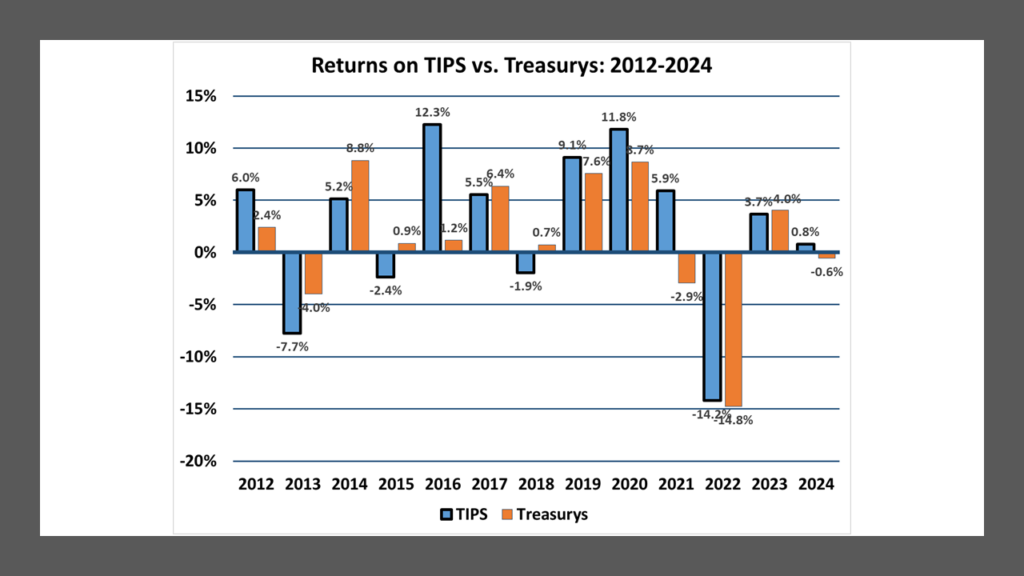
Treasury Inflation-Protected Securities (TIPS) posted an average loss of 3.8% in the 2024 fourth quarter, better than the 4.1% average loss on comparable maturity straight Treasury securities. The return on TIPS was composed of an estimated average price loss of 450 basis points (bp), interest income of 45 bp and an inflation adjustment of 35 bp.
TIPS outperformed Treasurys in the short- and intermediate maturities, but suffered comparable percentage losses in the longer maturities. The relative performance difference for TIPS was +56 bp on the short end, +44 bp in the intermediates and –9 bp on the long maturities, according to my calculations.
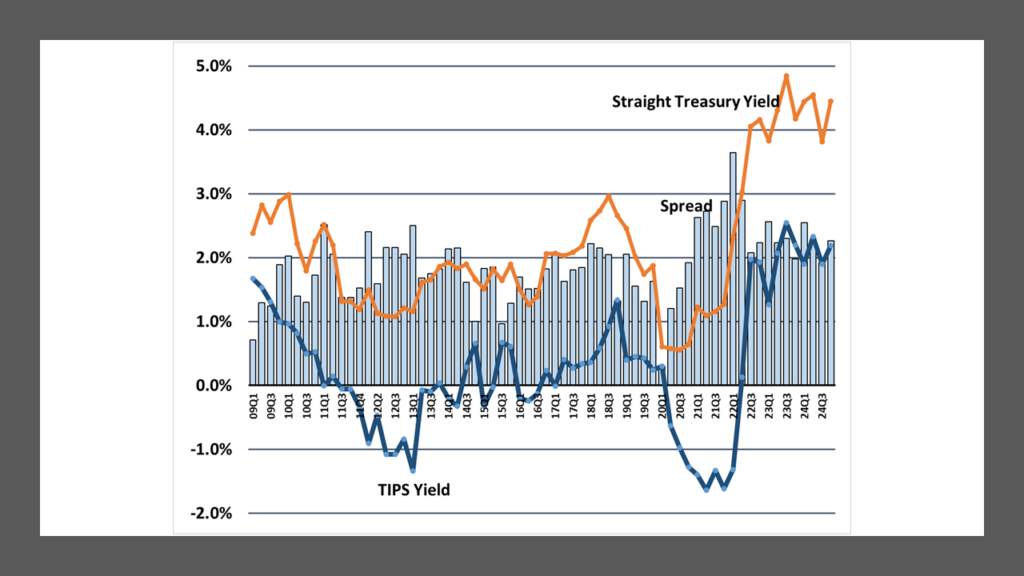
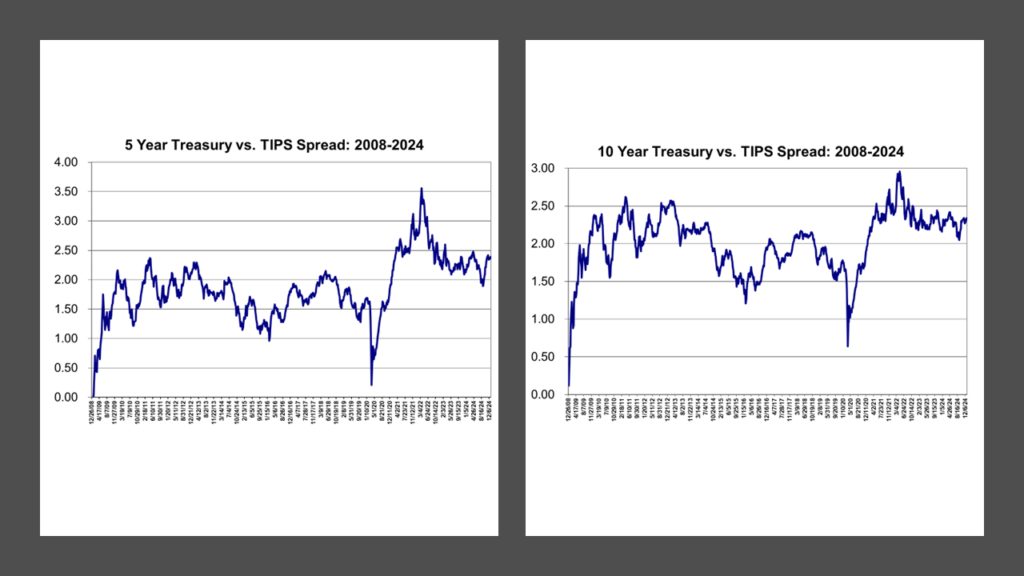
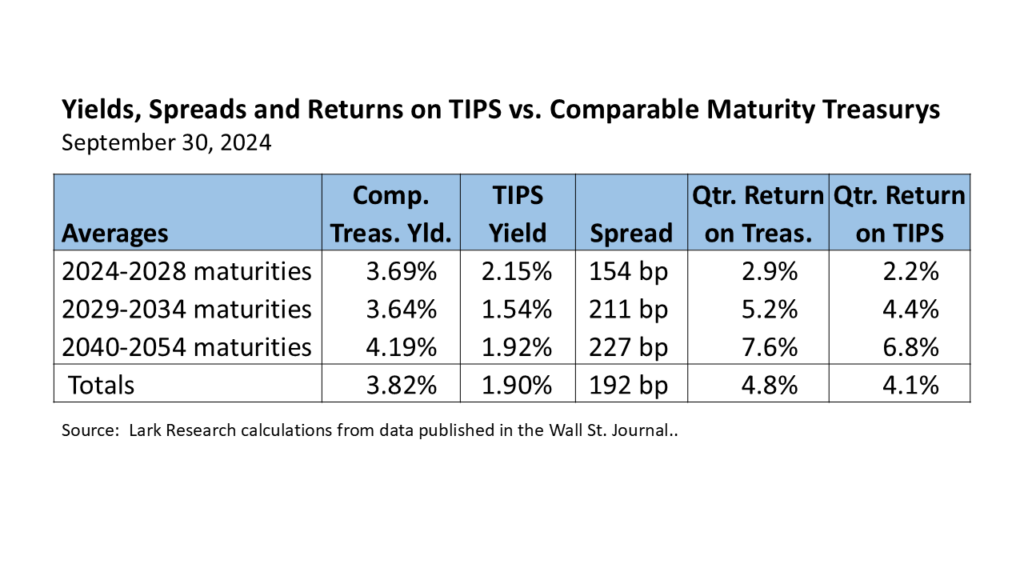
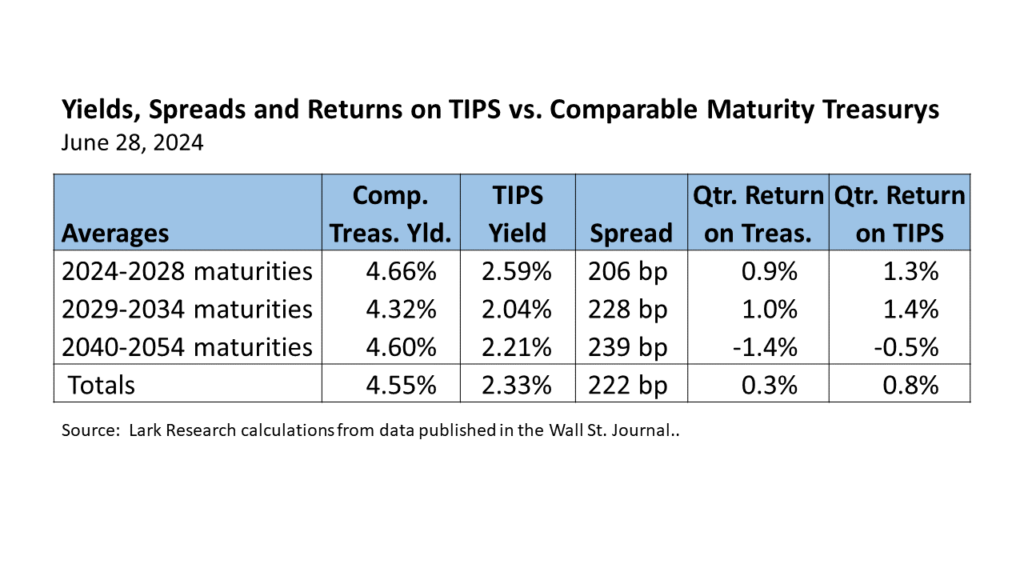
The average TIPS yield ended the quarter at 2.19%, up 29 basis points (bp) from 1.90% at the end of the 2024 third quarter. TIPS yields fell 7 bp in the short maturities, but rose 56 bp in the intermediates and 54 bp in the long maturities. Average straight Treasury yields ended the quarter at 4.45%, up 63 bp from 3.82% in 24Q3. Short-maturity Treasury yields rose 52 bp, intermediates 78 bp and long maturities 63 bp. With the changes in relative yields, the breakeven spread rose by 34 bp to 226 bp at December 31 from 192 bp at September 30.
As noted, the CPI inflation adjustment was just 35 bp. This reflected the slower pace of inflation over the past few months. Price gains therefore drove TIPS losses. TIPS suffered from the increase in interest rates, but not quite as much as comparable maturity straight Treasurys.
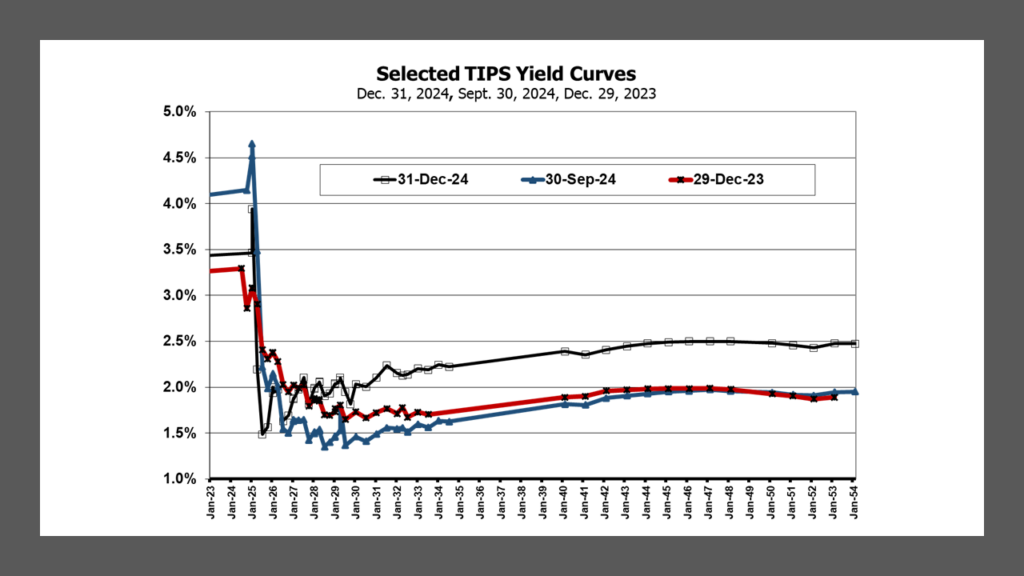
As noted, TIPS yields increased by 29 bp on average. The TIPS yield curve shifted upward in the intermediate and long-term maturities, ending the year about 40 bp above beginning year levels. The rise in yields came mostly at year end, driven by expectations that the FOMC would keep interest rates higher for longer; but breakeven spreads also rose, signaling slightly higher inflation expectations.
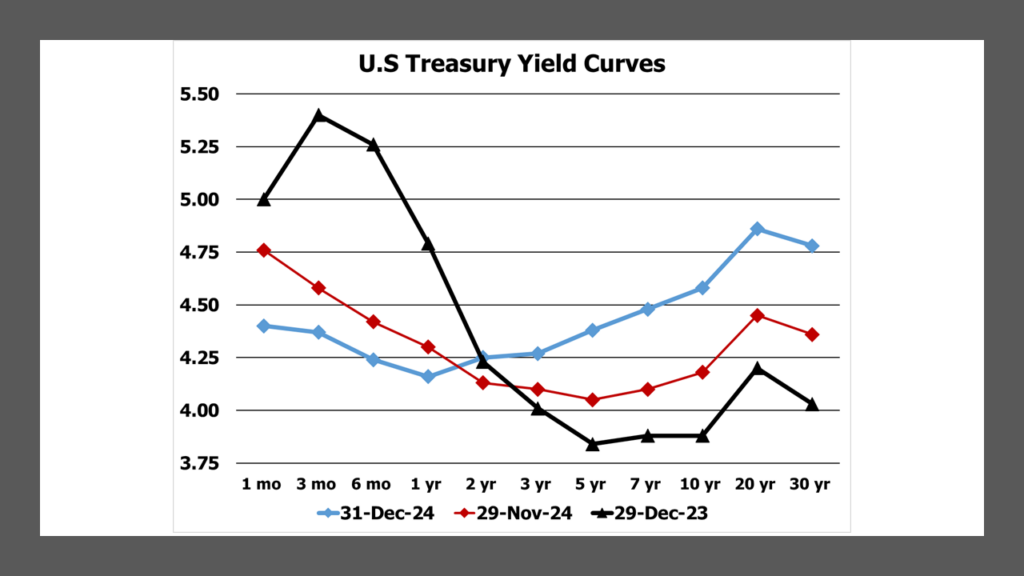
The reshaping of the Treasury yield curve was much more pronounced than the TIPS yield curve. During the course of the year, the Treasury yield curve shifted from downward sloping to upward sloping, with the two-year yield serving as the fulcrum at around the 4.25% level. The 100 bp drop in the Fed Funds target rate pushed the short end of the curve lower; while expectations of a slower pace of rate cuts by year end helped pulled longer term yields higher. The yield curve shifted from relatively flat in November to more clearly upward sloping in December, a sign perhaps of reduced concerns about the likelihood of a recession.
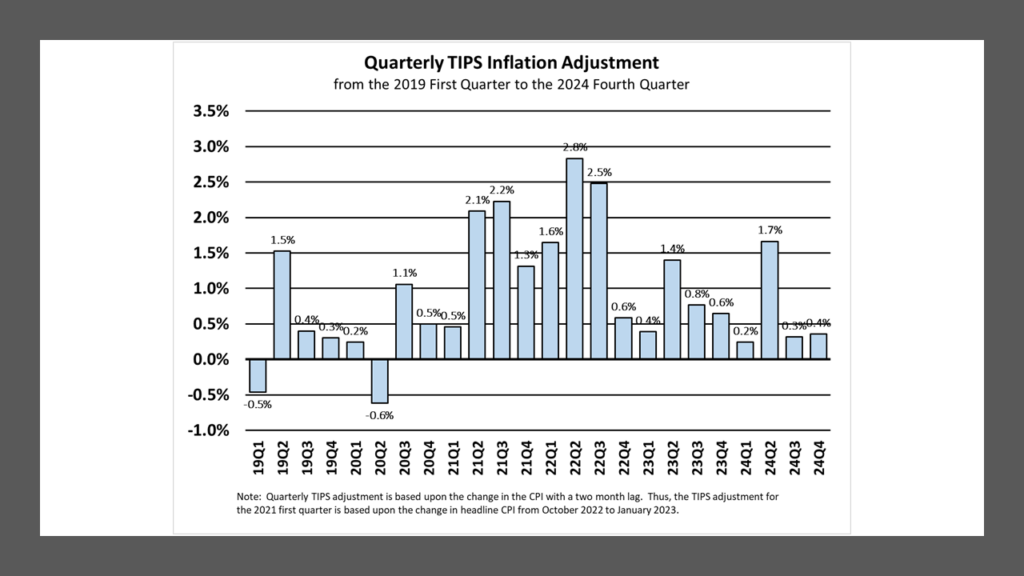
The quarterly TIPS adjustment was 0.4% in 24Q4, slightly higher than 24Q3’s 0.3% increase. The total TIPS adjustment was 2.6% in 2024, down from 3.2% in 2023 and 7.5% in 2022. The latest Survey of Professional Forecasters from the Philadelphia FRB anticipates that headline CPI inflation will slow further to 2.3% in 2025 and then to 2.2% in 2026, both essentially in line with current breakeven spreads.
While there is some concern about the possibility of an increase in inflation if the incoming Trump administration follows through with its threats to raise tariffs and deport undocumented immigrants, it seems more likely that the modest consensus inflation forecasts will be realized, as the pace of employment growth and economic activity slows. Consequently, there is room, I believe, for interest rates to head lower in 2025, perhaps by more than current expectations of two 25 bp Fed Funds target rate cuts. If so, both TIPS and straight Treasurys should earn positive returns in 2025, with greater total return potential across the longer maturities, as the yield curve flattens.
January 9, 2025
Stephen P. Percoco
Lark Research
839 Dewitt Street
Linden, New Jersey 07036
(908) 975-0250
admin@larkresearch.com
© 2015-2025 by Stephen P. Percoco, Lark Research. All rights reserved.
This blog post (as with all posts on this website) represents the opinion of Lark Research based upon its own independent research and supporting information obtained from various sources. Although Lark Research believes these sources to be reliable, it has not independently confirmed their accuracy. Consequently, this blog post may contain errors and omissions. Furthermore, this blog post is a summary of a recent report published on this subject and that report provides a more complete discussion and assessment of the risks and opportunities of any investment securities discussed herein. No representation or warranty is expressed or implied by the publication of this blog post. This blog post is for informational purposes only and shall not be construed as investment advice that meets the specific needs of any investor. Investors should, in consultation with their financial advisers, determine the suitability of the post’s recommendations, if any, to their own specific circumstances. Lark Research is not registered as an investment adviser with the Securities and Exchange Commission, pursuant to exemptions provided in the Investment Company Act of 1940. This blog post remains the property of Lark Research and may not be reproduced, copied or similarly disseminated, in whole or in part, without its prior written consent.