Once Again, TIPS Outperform Treasurys as Investors Bet on Higher Inflation.
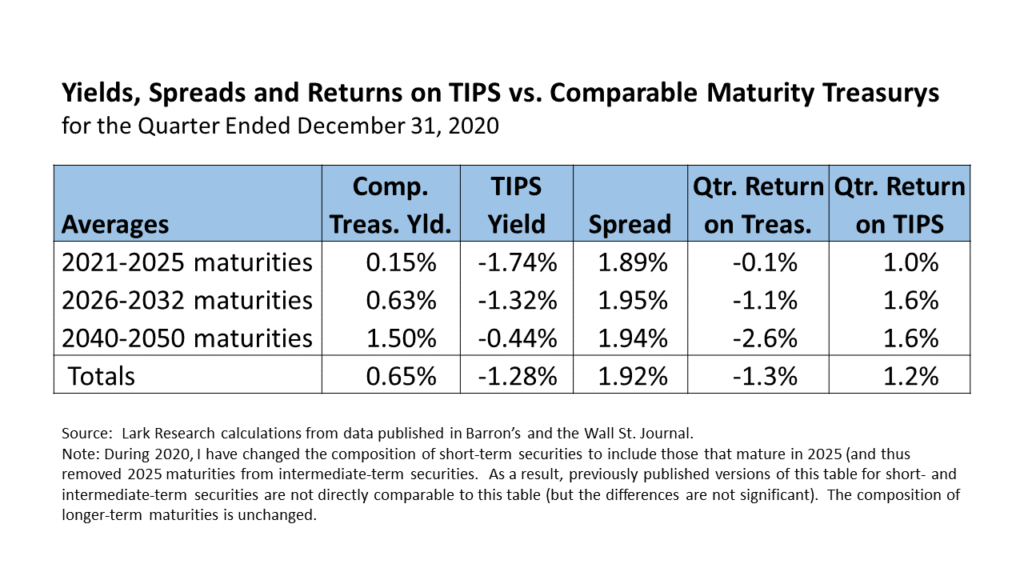
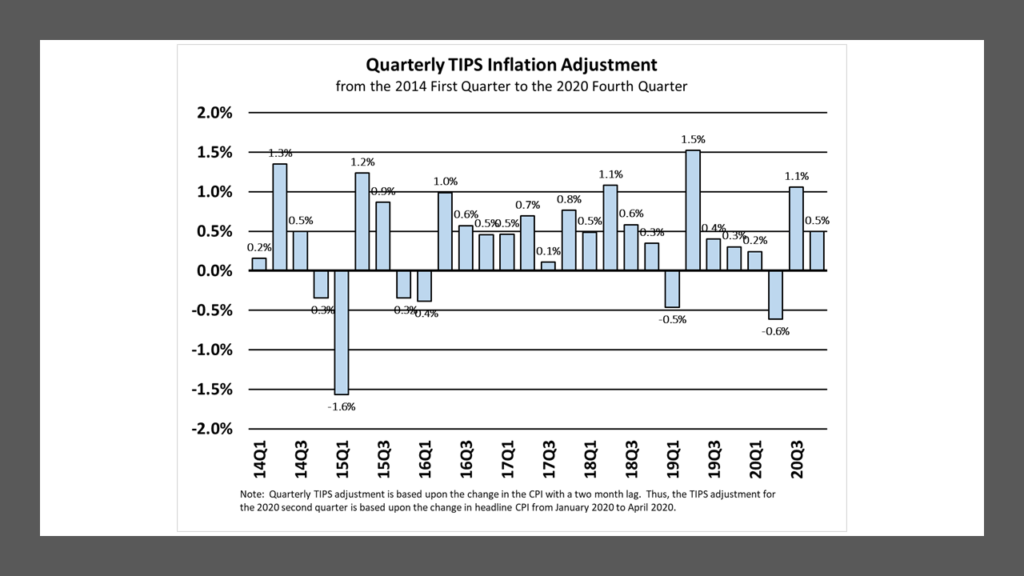
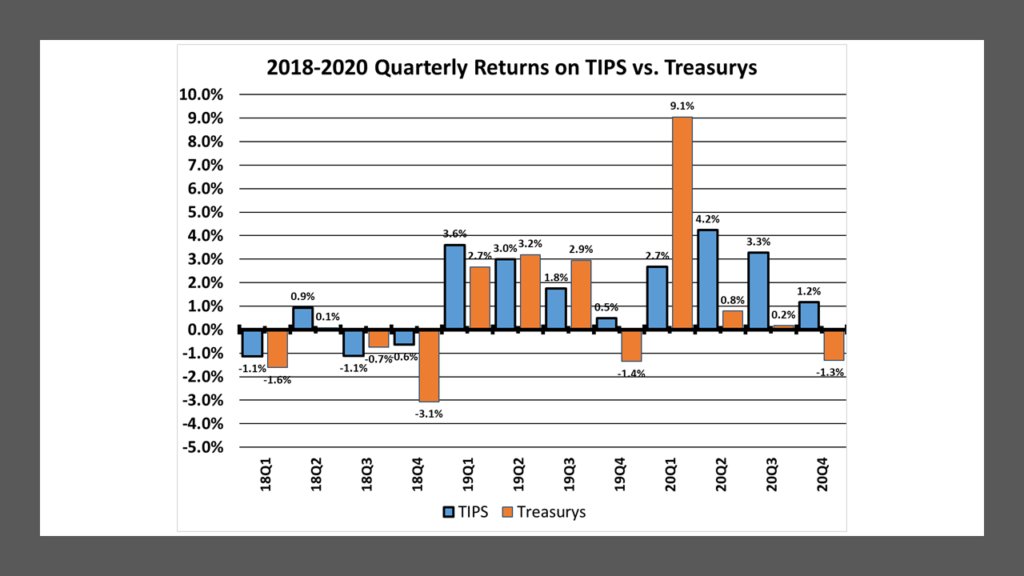
Treasury Inflation-Protected Securities (TIPS) outperformed comparable maturity straight Treasury securities significantly in the 2020 fourth quarter, posting a total return of 1.2% compared with a loss of 1.3% for straight Treasurys. The gains by TIPS drove their average yield even further into negative territory – to ‑1.28% from ‑0.97% in the 2020 third quarter and ‑0.63% in the 2020 second quarter. This quarter’s inflation adjustment, measured by the quarterly change in the headline CPI, was 0.50%.
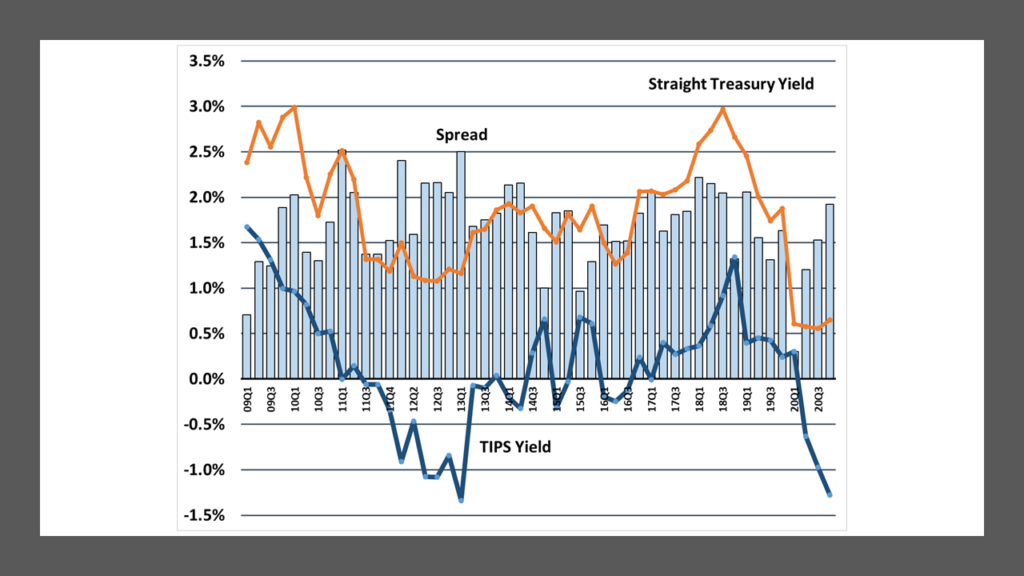
The average TIPS yield declined 31 basis points (bp), while the average yield on comparable maturity U.S. Treasury securities increased by 9 bp. As a result, the Treasury-TIPS yield spread (also known as the breakeven spread) increased 39 bp to 192 bp, above the long-term average spread of 170 bp.
The average TIPS yield has declined 158 bp since 20Q1 and 262 bp since peaking at 1.34% in 18Q4, when the Fed abruptly reversed course on its plan to normalize interest rates. Although above the 170 bp long-term average, the 20Q4 Treasury-TIPS spread of 192 bp is still below the post-financial crisis high of 252 bp recorded in 11Q1.
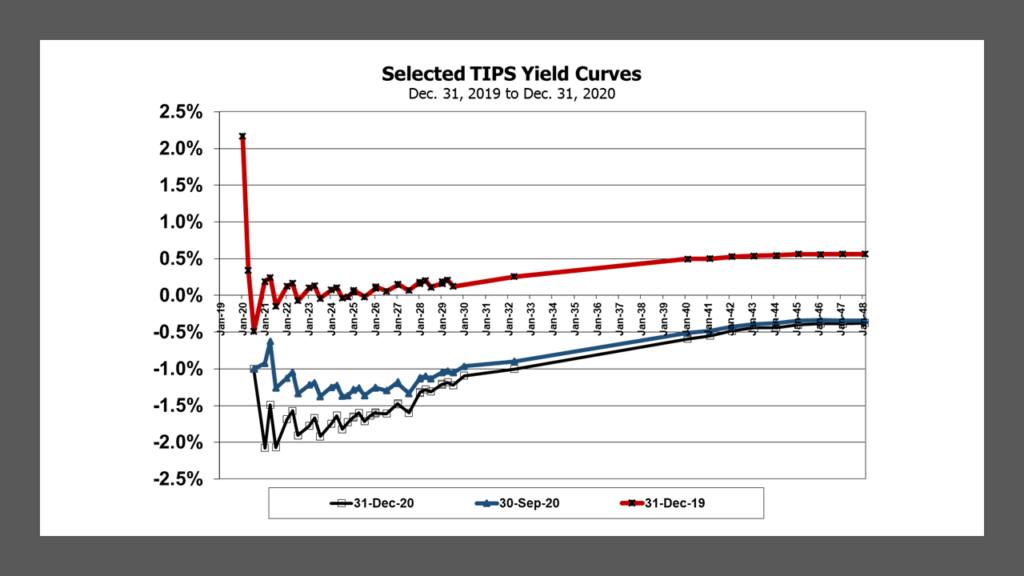
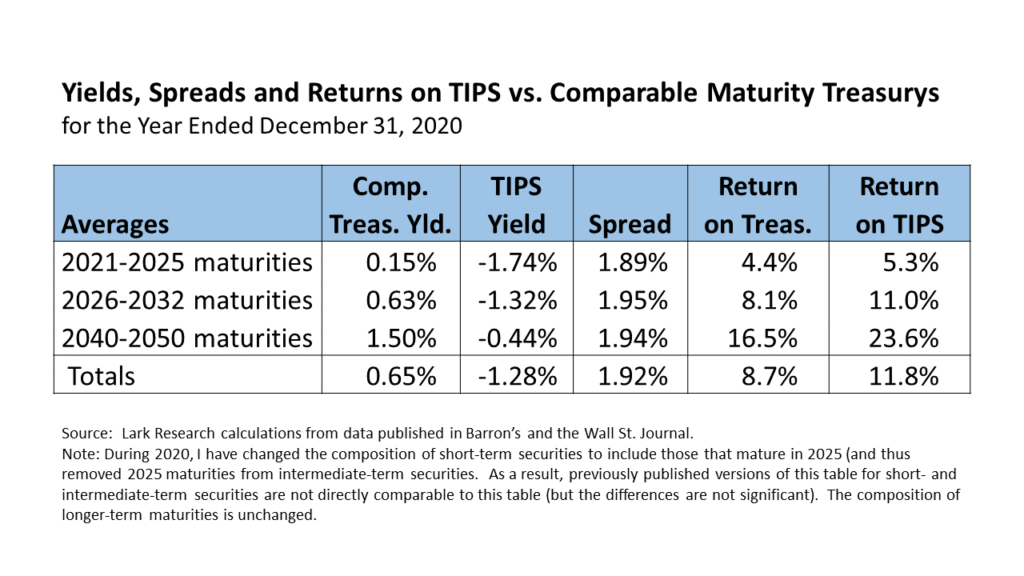
Most of the decline in the average TIPS yield in 20Q4 is explained by the drop in yields across shorter-maturity TIPS, as shown in the table above. Average short-term TIPS yields fell 53 bp to -1.74%, while intermediate TIPS yields declined 20 bp to 1.32% and long-term TIPS yields eased 5 bp to -0.44%.
By comparison, the U.S. Treasury Yield curve increased across the longer maturities, as shown in the chart below. Short-term Treasury yields were essentially unchanged. The 10-year Treasury yield increased 24 bp to 0.93% and 30-year Treasury yield rose 19 bp to 1.65%.
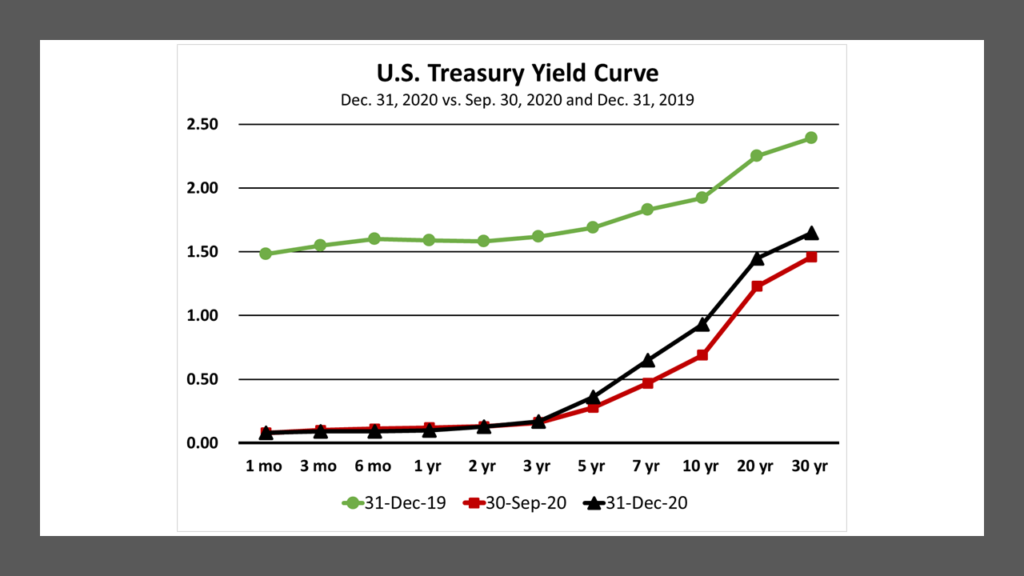
The rise in long-term Treasury yields was the primary driver of the average negative return of ‑1.3% across all comparable maturities in 20Q4.
During the year just ended, U.S. Treasury yields plunged in March with the onset of the pandemic, but rebounded slightly soon after. They held steady for most of the rest of the year but began to rise at the long end of the curve beginning of November, perhaps because of an improving economic outlook with the quick resolution to the presidential election and the beginning of the rollout of a COVID-19 vaccine. Still, Treasury yields ended the year down 125 bp on average from 2019. with short maturities falling 140-150 bp and long maturities declining 75-80 bp.
By comparison, TIPS yields rose slightly on average in 20Q1 and then declined by roughly 30 bp per quarter for the balance of the year. For the full year, the average TIPS yield fell 152 bp from 0.24% to ‑1.28%.
Short-term TIPS yields jumped from 0.18% at the beginning of the year to 0.70% in March, presumably on expectations that the pandemic driven recession would spark a collapse in consumer price inflation. Since 20Q1 average short-term TIPS yields have fallen by 244 bp.
In contrast, intermediate and long-term TIPS yields declined in 20Q1, but not as much as comparable maturity Treasury yields. As a result, spreads tightened across intermediate maturities from 170 bp in 19Q4 to 62 bp in 20Q1 and across longer maturities from 181 bp in 19Q4 to 111 bp in 20Q1. After 20Q1, spreads widened for both intermediate and longer maturities for the remainder of the year, with Treasury yields essentially holding steady and TIPS yields falling more deeply negative.
During the course of the year, the average Treasury-TIPS spread (across all maturities) plunged from 163 bp in 19Q4 to only 30 bp in 20Q1, but then rebounded to 120 bp in 20Q2, 153 bp in 20Q3 and finally to 192 bp in 20Q4.
The rally in TIPS throughout 2020 has been fueled by rising inflation expectations. The Federal Reserve has encouraged this by saying it will keep interest rates lower for longer, even if inflation runs above its long-term target of 2% for a time. In addition, the U.S. dollar has been on a steady decline since peaking in March. A lower dollar raises the cost of imports and so is often a key driver of inflation. Finally, commodity prices have been rallying, especially in 20Q4, across a wide range of products, including oil (and its derivatives, such as heating oil and gasoline), copper, lumber, corn, soybeans, and coffee. Still, inflation driven by higher import and commodity prices may appear in some categories of consumer goods and services with a lag.
With one month left to go in the data for 2020, the unadjusted headline Consumer Price Index (CPI) (for the All Urban Consumer or CPI-U), which is the index that determines the inflation adjustment on TIPS, is up 1.17%. By comparison, the CPI-U increased 2.44% in 2018 and 1.81% in 2019.
In 2020, the CPI-U declined 0.23% from December 2019 to April 2020, but rebounded 1.5% from April to November 2020. The unadjusted index has been flat since September. However, according to the Bureau of Labor Statistics’ seasonally-adjusted figures, the CPI was up 0.2% from August to September, flat from September to October and up 0.2% from October to November. Seasonal adjustments are meant to better reflect short-term price movements, but the BLS emphasizes that the unadjusted index is the better measure of actual changes in consumer prices, especially over the longer term.
By quarter, the actual inflation adjustment for TIPS (which is based upon changes in headline CPI-U with a two-month lag) was 0.24% in 20Q1, -0.61% in 20Q2, 1.06% in 20Q3 and 0.50% in 20Q4.
With the CPI’s rebound off the April-May lows, the consensus view of economists, as reflected in the Philadelphia Federal Reserve’s Survey of Professional Forecasters, now anticipates that the annualized increase in the CPI will be 2.0% in 20Q4, up from 1.6% in its previous survey. It also anticipates that headline CPI will increase 2.0% in 2021, up from 1.8% previously.
The Philly Fed forecasters project a slower rate of economic growth of 4.0% (annualized) for 20Q4, below its previous forecast of 5.4%. However, they now anticipate real GDP growth of 4.0% in 2021, up from 3.2% previously, with growth decelerating to 2.1% in 2023. Those growth rates seem out of step with the current low Treasury yields and negative TIPS yields. If those GDP growth expectations are realistic, interest rates should presumably be higher; but they are being held lower by Federal Reserve policies. (The Fed probably would say that interest rates need to be held lower to ensure that those rates of growth are achievable.)
If the forecast holds true, then presumably interest rates should rise 100 bp – 140 bp sometime over the next two years. If inflation remains stuck at 2.0%, then TIPS yields should rise commensurately. A faster rate of inflation could slow the rise in TIPS yields, but this would presumably be temporary, since the Fed, under its current policy regime, is unlikely to tolerate inflation at that level indefinitely. Accordingly, if the Treasury and TIPS yield curves shift up in parallel sometime over the next two years, both will suffer negative returns.
In the near-term, there is still room for TIPS to rally (both absolutely and relative to straight Treasurys), but without a meaningful change in the economic and financial environment, that headroom room for TIPS appears to be increasingly limited. With the 20Q4 rally, TIPS yields are near their lowest level ever. It seems unlikely that investors will accept TIPS yields that are much more negative.
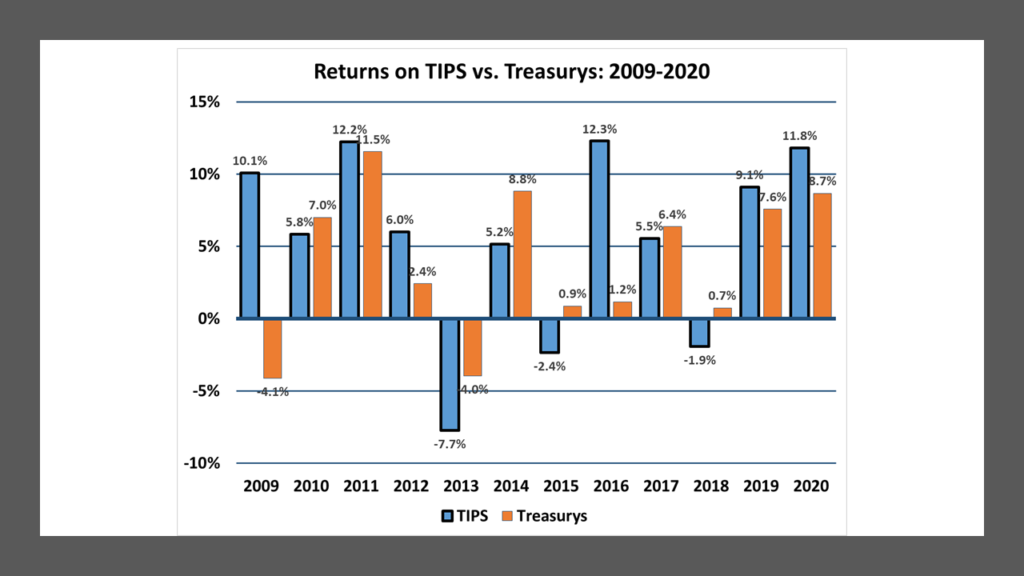
My data shows that the lowest average yield on TIPS was ‑1.34% in 13Q1, not much lower than the current average TIPS yield of ‑1.28%. Similarly, the widest breakeven spread was 252 bp in 11Q1 (and also 250 bp in 13Q1), which is about 60 bp above the current level. It is perhaps noteworthy that after reaching that historically low yield in 13Q1, TIPS posted a total return of ‑6.6% in 13Q2.
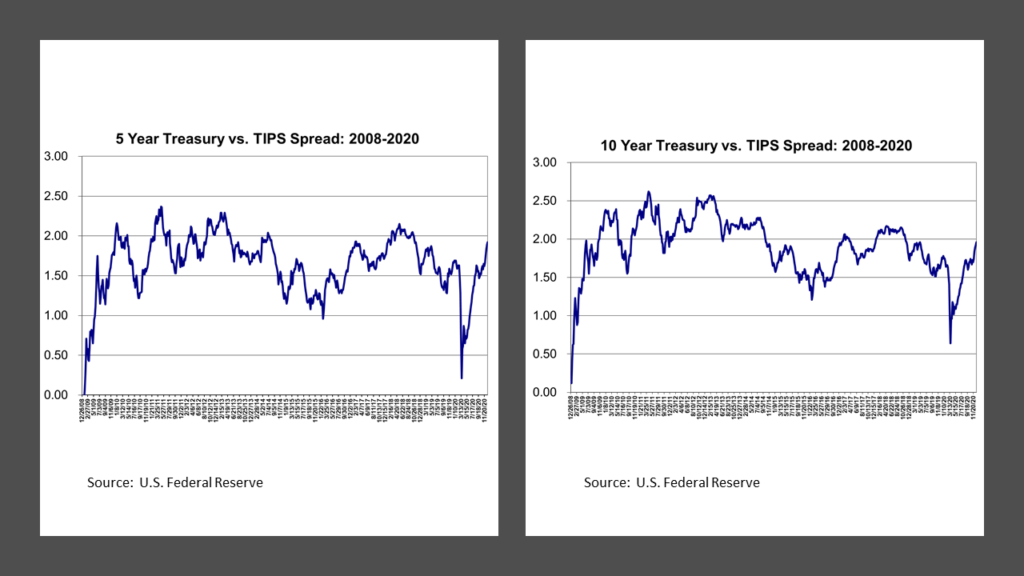
It may be useful to see TIPS yields and spreads as an arbitrage with straight Treasurys and inflation. The inflation adjustment is meant to compensate the TIPS investor for accepting a lower yield, but it by no means guarantees that investors will be protected against inflation. In the current environment, the inflation adjustment makes up for the negative yield, bringing the total return to a level consistent with the return on straight Treasurys. However, with the current average Treasury yield of just 0.65%, investors in Treasurys (and TIPS after the inflation adjustment) are earning a return that is below the current inflation rate of 1.17%.
On a relative basis, investors in TIPS can outperform straight Treasurys, if the CPI adjustment exceeds the current breakeven spread. This is especially relevant for intermediate and long-term TIPS. Investors in short maturity TIPS, however, may have other considerations, including the desire to protect against loss of principal.
January 3, 2021
Stephen P. Percoco
Lark Research
16 W. Elizabeth Avenue, Suite 4
Linden, New Jersey 07036
(908) 975-0250
spercoco@larkresearch.com
www.larkresearch.com
© 2021 Lark Research. All rights reserved.
You must be logged in to post a comment.