TIPS Outperform Treasurys in 25Q1 as Investors Seek Protection from Tariffs
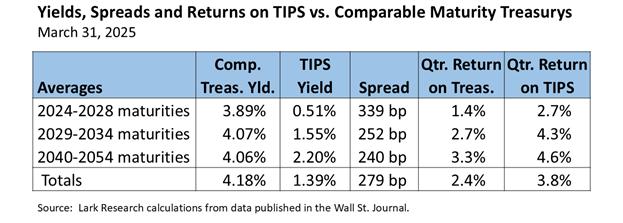
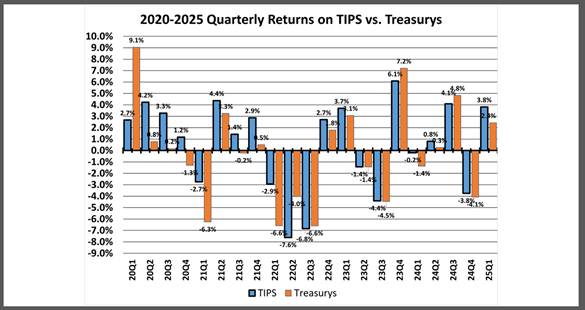
Treasury Inflation-Protected Securities (TIPS) posted an average gain of 3.8% in the 2025 first quarter, exceeding the 2.4% gain on comparable maturity straight Treasury securities. The return on TIPS was composed roughly of an estimated average price gain of 300 basis points (bp), interest income of 50 bp and an inflation adjustment of 60 bp.
TIPS outperformed Treasurys handily across all maturities. The relative performance difference for TIPS was 130 bp on the short end, 160 bp in the intermediates and 130 bp on the long maturities, according to my calculations.
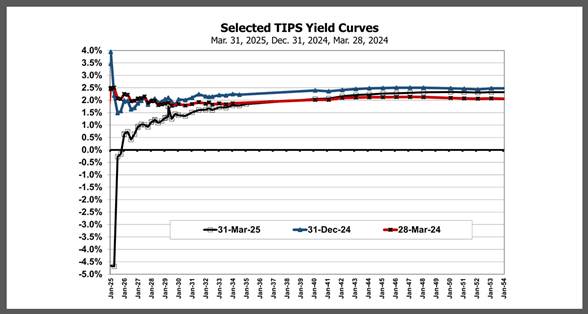
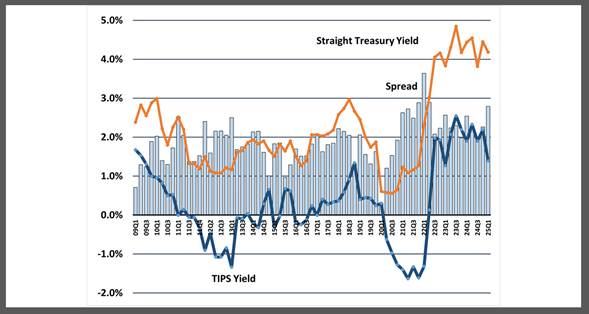
The average TIPS yield ended the quarter at 1.39%, down 80 basis points (bp) from 2.19% at the end of the 2024 fourth quarter. TIPS yields fell 156 bp in the short maturities, 55 bp in the intermediates and 20 bp in the long maturities. Average straight Treasury yields ended the quarter at 4.18%, down 27 bp from 4.45% in 24Q4. Short-maturity Treasury yields declined 33 bp, intermediates 35 bp and long maturities 16 bp. With the changes in relative yields, the breakeven spread rose by 53 bp to 279 bp at March 31 from 226 bp at December 31.
As noted, the CPI inflation adjustment was 60 bp. This reflected a modest pickup in inflation over the past few months. Price gains explain most of TIPS total return for the quarter. TIPS benefited from a greater decline in interest rates than comparable maturity straight Treasurys, as investors paid up for inflation protection.
As noted, TIPS yields declined by 80 bp on average. The TIPS yield curve shifted downward across all maturities, with the shortest maturities ending the quarter with negative yields. Yields on very short maturity TIPS are often quite volatile because small price moves can result in much greater changes in yields.
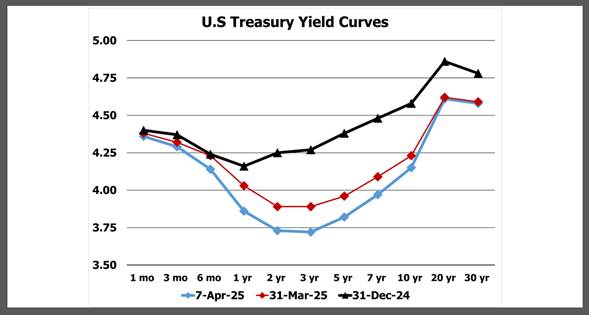
Since the end of 2024, the straight Treasury yield curve shifted downward, but short and long-term yields have dropped far less than intermediates. Thus the Treasury yield curve has sagged in the middle. Technically, the yield curve remains upward sloping with the highest yields in the longest maturities. However, falling intermediate yields suggest a greater risk of an intermediate-term economic slowdown.
The quarterly TIPS adjustment was 0.6% in 25Q1, slightly higher than 24Q4’s 0.4% increase. Although the major tariff announcements that have rattled the financial markets did not come until early April, it does appear that TIPS investors were anticipating the bad news. The tariffs will likely cause a pick up in inflation, but it is difficult to predict how quickly they will show up in consumer prices.
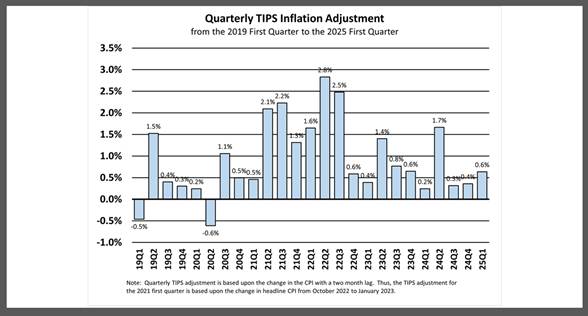
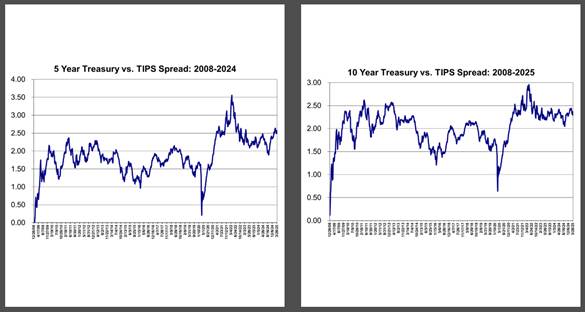
Although the increase in the breakeven rate from 226 bp to 279 bp suggests a meaningful ratcheting up of inflation expectations, the increase was much more pronounced – 125 bp – in the short-maturities. The breakeven rate for long-maturities increased by only 4 bp. This suggests that TIPS investors expect that the rise in inflation will be primarily a short-term phenomenon. We will see whether this expectation holds over time.
At the end of 25Q1, the breakeven rate of 279 bp was higher than the 16-year average of 189 bp, but below the maximum spread of 364 bp recorded in 22Q1. Thus, if history is a guide, there still may be some upside potential in TIPS returns, which may lead to higher breakeven spreads; but the relative upside vs. straight Treasurys would appear to be more limited as a result of the 25Q1 gains.
April 8, 2025
Stephen P. Percoco
Lark Research
839 Dewitt Street
Linden, New Jersey 07036
(908) 975-0250
admin@larkresearch.com
© 2015-2025 by Stephen P. Percoco, Lark Research. All rights reserved.
This blog post (as with all posts on this website) represents the opinion of Lark Research based upon its own independent research and supporting information obtained from various sources. Although Lark Research believes these sources to be reliable, it has not independently confirmed their accuracy. Consequently, this blog post may contain errors and omissions. Furthermore, this blog post is a summary of a recent report published on this subject and that report provides a more complete discussion and assessment of the risks and opportunities of any investment securities discussed herein. No representation or warranty is expressed or implied by the publication of this blog post. This blog post is for informational purposes only and shall not be construed as investment advice that meets the specific needs of any investor. Investors should, in consultation with their financial advisers, determine the suitability of the post’s recommendations, if any, to their own specific circumstances. Lark Research is not registered as an investment adviser with the Securities and Exchange Commission, pursuant to exemptions provided in the Investment Company Act of 1940. This blog post remains the property of Lark Research and may not be reproduced, copied or similarly disseminated, in whole or in part, without its prior written consent.
You must be logged in to post a comment.