TIPS Outperform Treasurys in 22Q4; Both TIPS and Treasurys Record Double-Digit Losses in 2022.
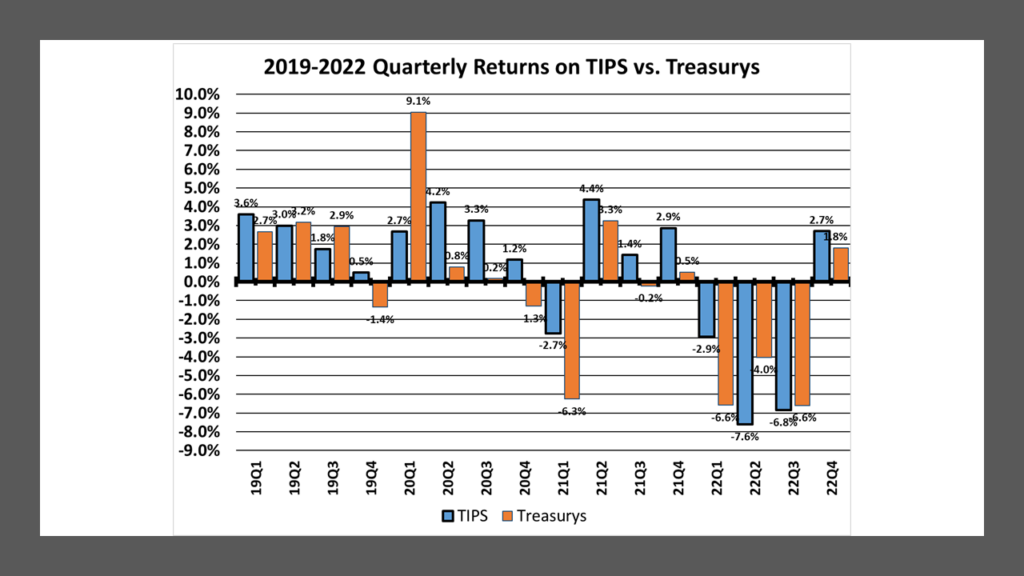
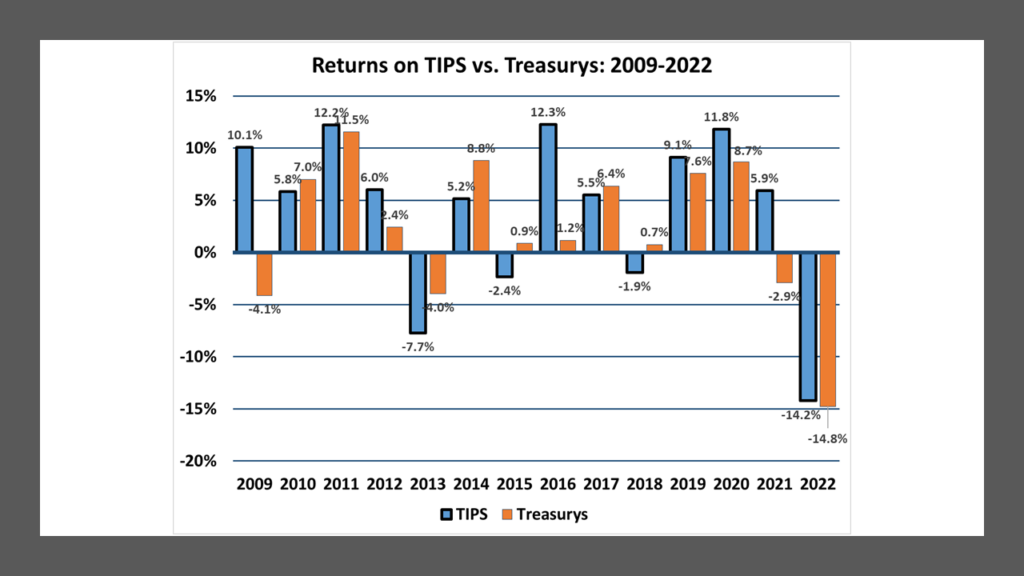
Treasury Inflation-Protected Securities (TIPS) suffered an average decline of 14.2% in 2022, only slightly better than the 14.7% decline in comparable maturity straight Treasurys. Their negative returns are also only moderately better than the declines experienced across most of the major equity market averages.
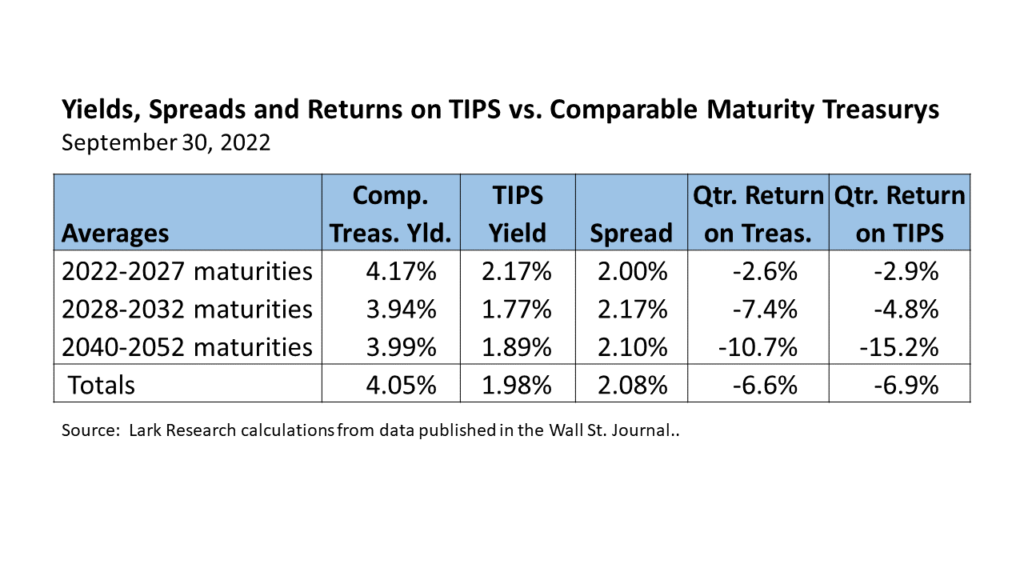
In 22Q4, TIPS posted an average gain of 2.7%, their first and only gain this year, and modestly exceeded the 1.8% average gain in comparable maturity straight Treasurys. TIPS underperformed Treasurys across the short and intermediate maturities, but outperformed significantly in the long maturities.
For 22Q4, comparable maturity Treasurys posted a 1.7% gain on the short end, a 3.0% gain in the intermediate maturities, but only a +0.1% return on the long maturities. Both the TIPS and U.S. Treasury yield curves were little changed in the quarter, a noticeable and welcome calm following the extraordinary volatility experienced during the preceding two quarters. The U.S. Treasury curve ended the year with less of an inversion, as yields rose across the long end of the curve. That followed the FOMC’s decision to slow the increase in the Fed Funds target rate to 0.50% at its December meeting.
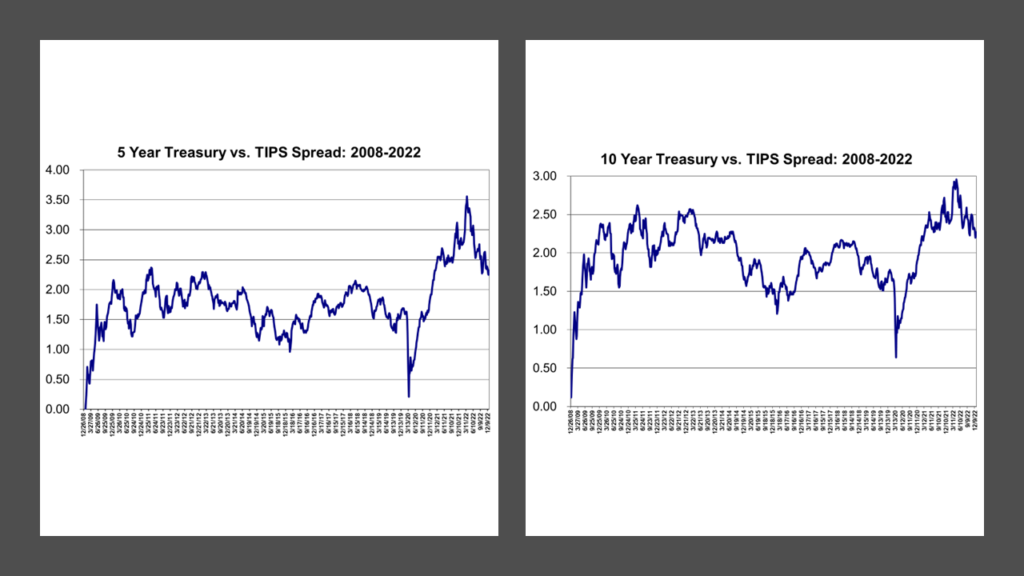
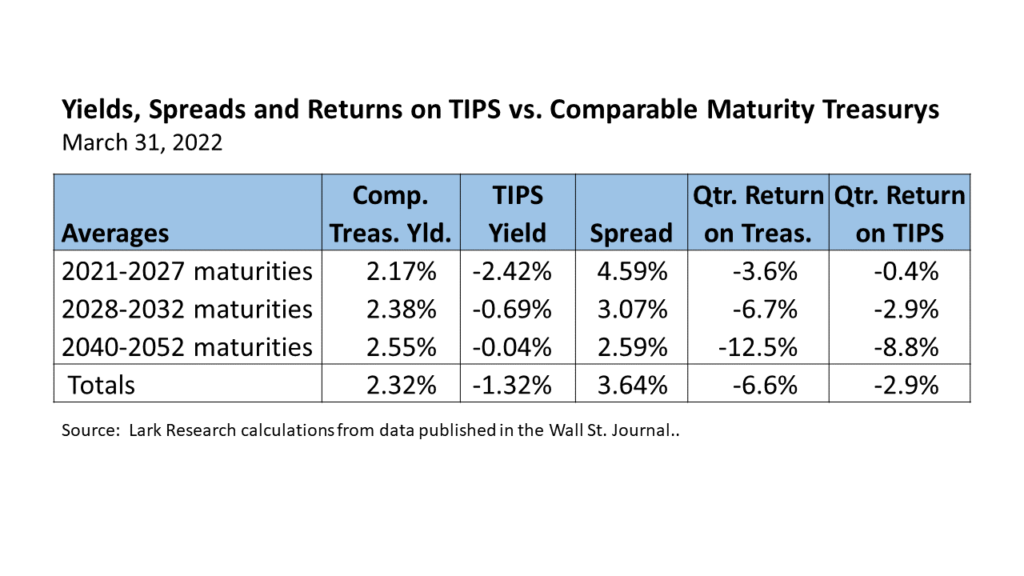
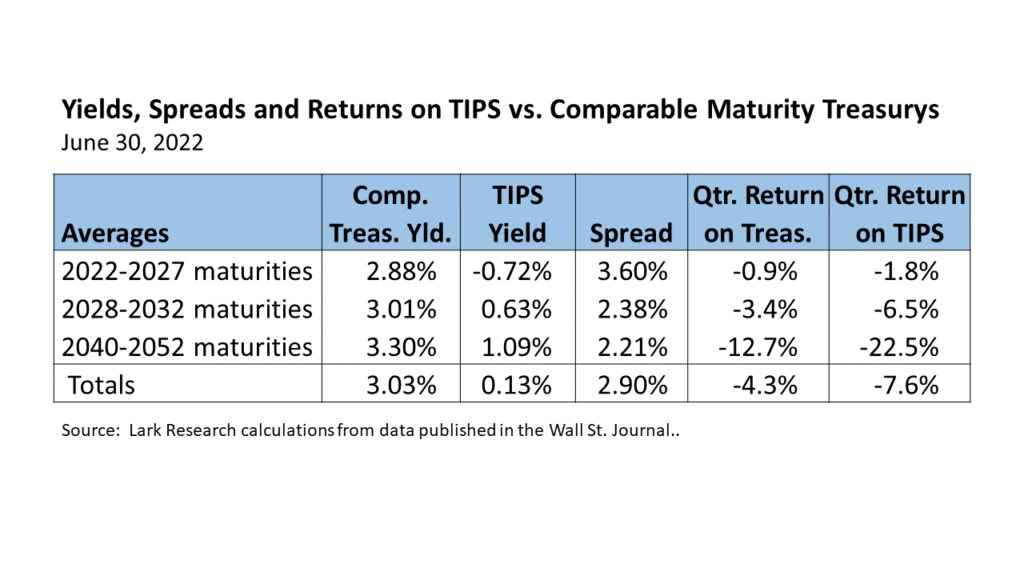
The average TIPS yield ended 22Q4 at 1.93%, down only 5 bp from 22Q3. Average straight Treasury yields ended the quarter at 4.16%, up 11 bp from 4.05% at 22Q3. This divergence in yield trends raised the breakeven spread by 15 bp to 223 bp at year-end. The increase in the breakeven spread is at odds with the general sentiment of declining inflation expectations; but the increase was small and therefore perhaps of little statistical significance.
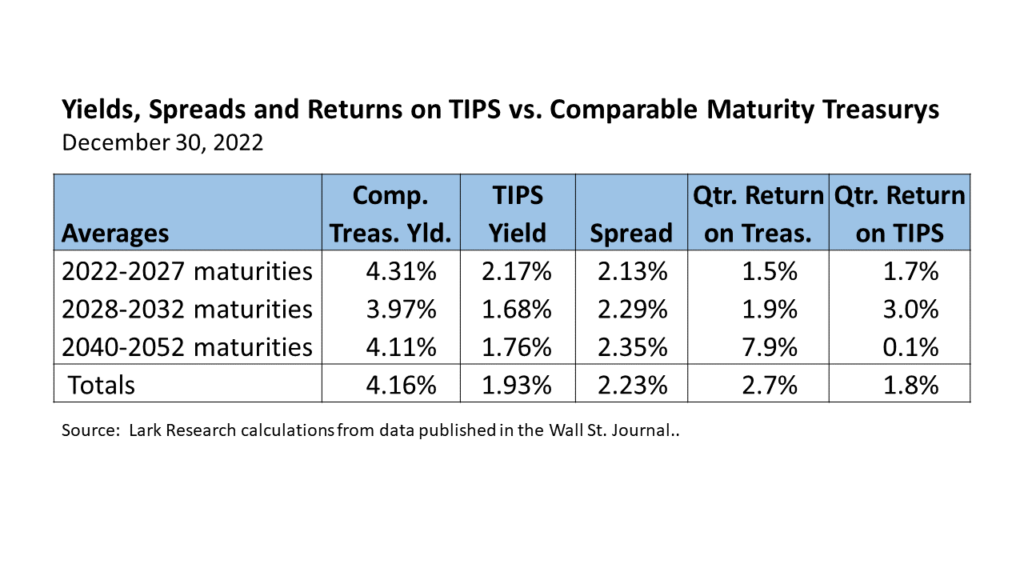
Breakeven spreads increased across all maturities: Short maturity spreads rose 13 bp to 213 bp in 22Q4. Intermediate spreads increased by 12 bp to 229 bp. Long-term spreads increased by 25 bp to 235 bp.
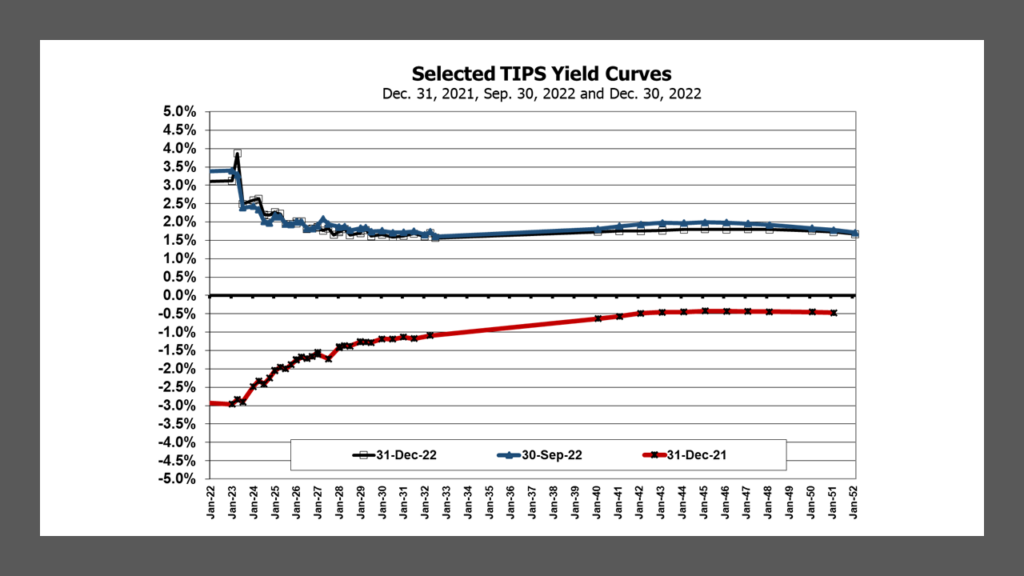
The average TIPS yield eased by 5 bp from 1.98% in 22Q3 to 1.93% in 22Q4. Short-maturity TIPS yields were unchanged at 2.17%; while intermediate TIPS yields slipped by 9 bp to 1.68% and long-maturity TIPS yields declined 13 bp to 1.76%. TIPS yields were little changed despite a decline in the CPI adjustment and expectations that the Fed Funds target rate will peak by mid-2023.
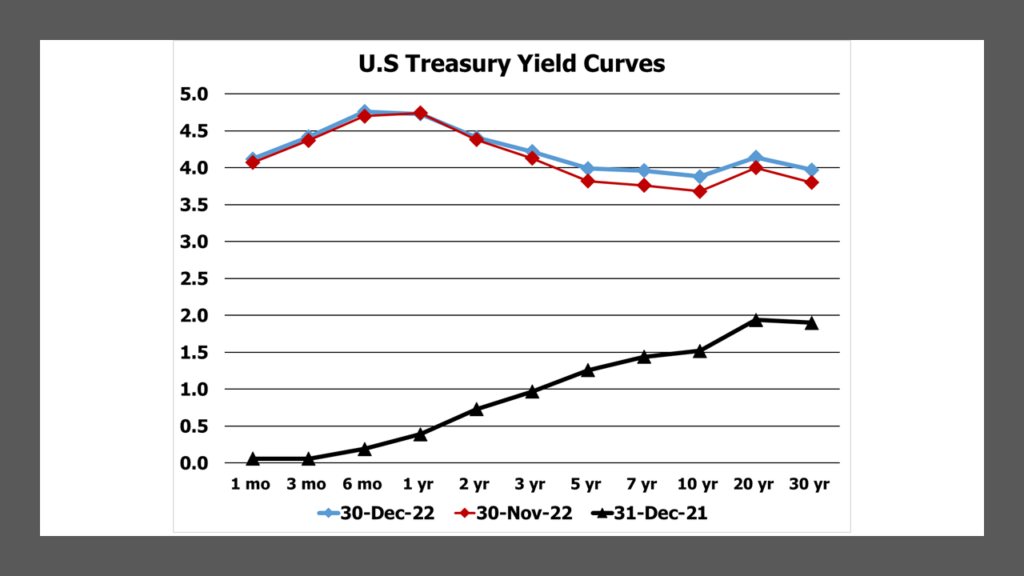
Comparable maturity straight Treasury yields were also little changed, declining by 11 bp to 4.16%. Short-maturity Treasury yields increased by 14 bp to 4.31%. Intermediate Treasury yields rose by only 3 bp to 3.97% and long-term Treasury yields by 12 bp to 4.11%. Short maturity yields are driven by Fed policy and so will likely rise as the FOMC pushes the Fed Funds target higher. The smaller increase in intermediate Treasury yields and larger increase in long-maturity yields may reflect an easing in inflation assumptions, with higher yields on the long-end signaling a reduced risk of an economic slowdown. However, the yield changes were small, so it may not be appropriate to read too much into the yield trends at this time. The flattening of the yield curve occurred during the final two weeks of the month, as stocks were falling; so equity investors apparently did not take it as an optimistic sign.
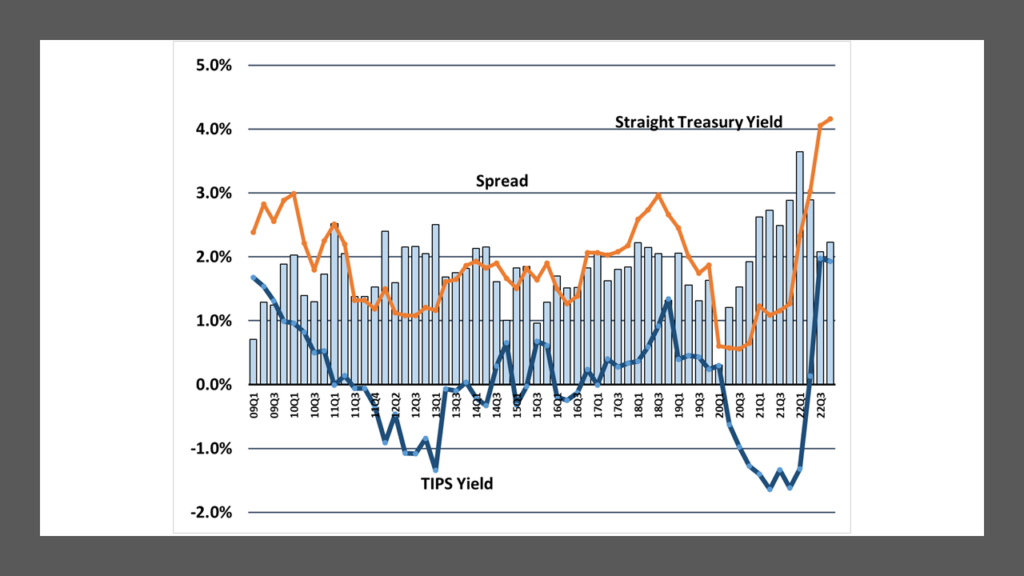
Both TIPS and Treasury yields remain at multi-year highs. Although the breakeven spread has fallen from the 22Q1 peak, remains at a multi-year high.
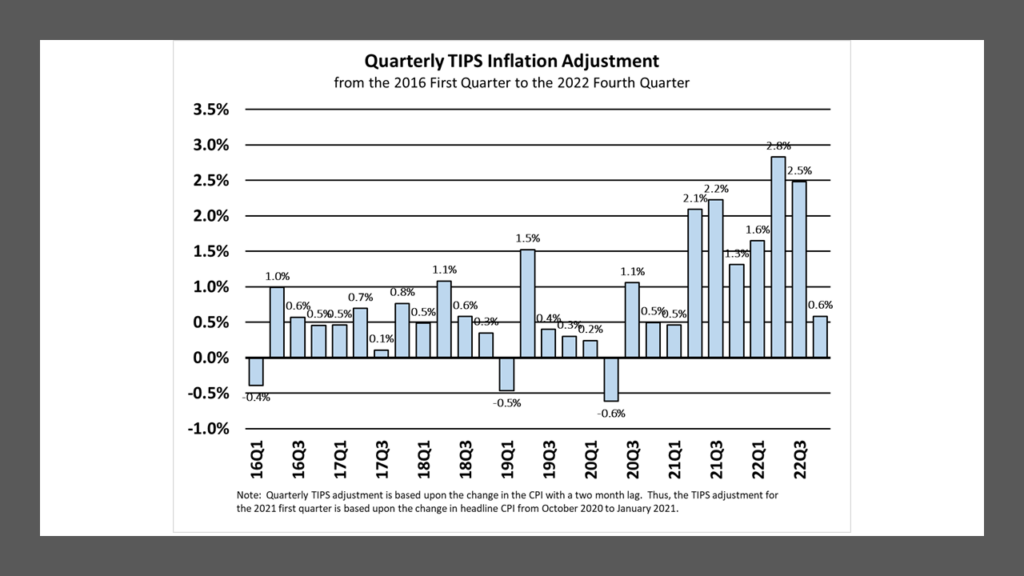
The 22Q4 CPI adjustment was 0.59%, down 189 bp from 2.48% in 22Q3 and down 224 bp from 22Q2’s record of 2.83%. The sharp drop in the adjustment reflected the much slower rise in headline CPI since July. November’s CPI print was also benign, with a 0.1% month-to-month decrease, potentially setting up for a modest increase in the CPI TIPS adjustment during 23Q1.
According to the CME’s Fed Watch tool, the futures market currently assigns a 67% probability to a 25 bp increase in the Fed Funds rate to 4.50%-4.75%, and a 33% chance of a 50 bp increase at the FOMC’s end of January meeting. It favors a 25 bp increase in March. After that, the probabilities are evenly split, but the tool currently anticipates a peak of 5.00%-5.25% by mid-year.
As of this writing, the change in commodity prices is mixed, with gasoline having increased 4.2% in December, but natural gas falling 35%. Other agricultural and precious metals prices are higher. The housing (rent and OER) components of CPI will also probably show further increases for at least a few more months. So the CPI may come in higher for December (than November), but probably not so high that it will materially change the market’s view that inflation is moderating.
Other factors that drive inflation are also mixed. The New York Fed’s Global Supply Chain Index rose slightly in November, after falling for most of 2022. Although it is down sharply from its December 2021 peak, the Index remains elevated compared to long-term average (going back to 1998).
The U.S. dollar, which has tempered inflation over the past year due to its meteoric rise, has given back about half of its 2022 gains since it peaked in October. This may offset some of the price moderation expected with the slowing economy.
On balance, despite the smaller 50 bp Fed Funds rate increase in December, FOMC participants raised their outlook for inflation modestly. Their median forecast now pegs PCE inflation at 3.1% in 2023, (up from 2.8% previously), with the core PCE rate at 3.5% (up from 3.2%). They also anticipate headline PCE falling to 2.5% in 2024.
With the reverberation throughout the fixed income markets of the 450 bp increase in the Fed Funds rate this year, the economy is heading for a slowdown, which may further temper the inflation outlook. Right now, with the average TIPS yield at 2% and inflation expected to fall to 3%, TIPS may be attractive relative to straight Treasurys for buy-and-hold investors as insurance against higher inflation.
However, there are wildcards in the mix, such as the war in Ukraine, and the reopening of China’s economy, which may bring surprises during the year. For now, the relative calm that we have seen in the fixed income markets is welcome and hopefully it will continue; but as with most financial sectors worldwide, investors should not become complacent.
January 3, 2023
Stephen P. Percoco
Lark Research
839 Dewitt Street
Linden, New Jersey 07036
(908) 975-0250
admin@larkresearch.com
© 2015-2025 by Stephen P. Percoco, Lark Research. All rights reserved.
This blog post (as with all posts on this website) represents the opinion of Lark Research based upon its own independent research and supporting information obtained from various sources. Although Lark Research believes these sources to be reliable, it has not independently confirmed their accuracy. Consequently, this blog post may contain errors and omissions. Furthermore, this blog post is a summary of a recent report published on this subject and that report provides a more complete discussion and assessment of the risks and opportunities of any investment securities discussed herein. No representation or warranty is expressed or implied by the publication of this blog post. This blog post is for informational purposes only and shall not be construed as investment advice that meets the specific needs of any investor. Investors should, in consultation with their financial advisers, determine the suitability of the post’s recommendations, if any, to their own specific circumstances. Lark Research is not registered as an investment adviser with the Securities and Exchange Commission, pursuant to exemptions provided in the Investment Company Act of 1940. This blog post remains the property of Lark Research and may not be reproduced, copied or similarly disseminated, in whole or in part, without its prior written consent.