TIPS Outperform Treasurys Again in 21Q4 as Inflation Concerns Rise
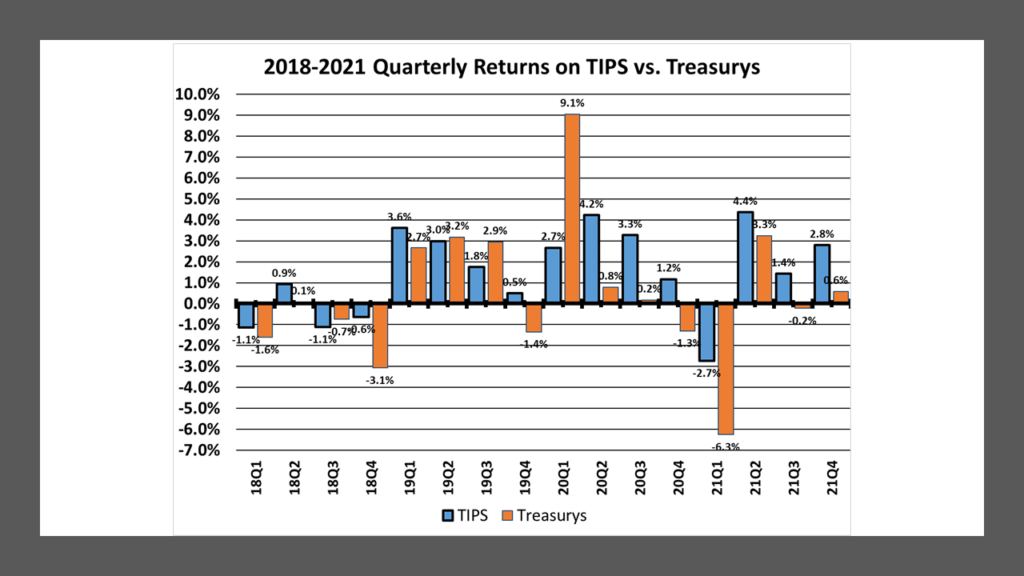
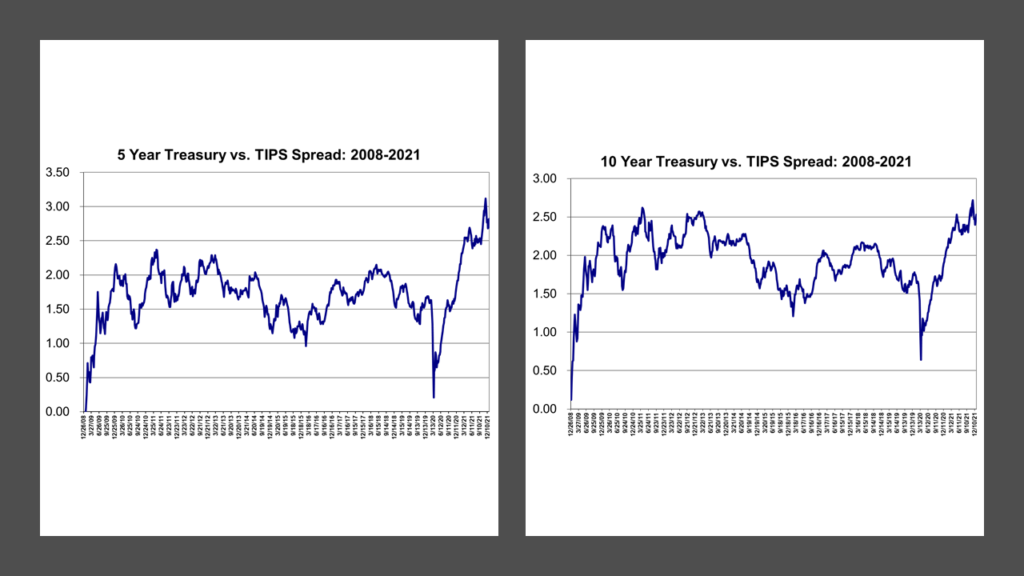
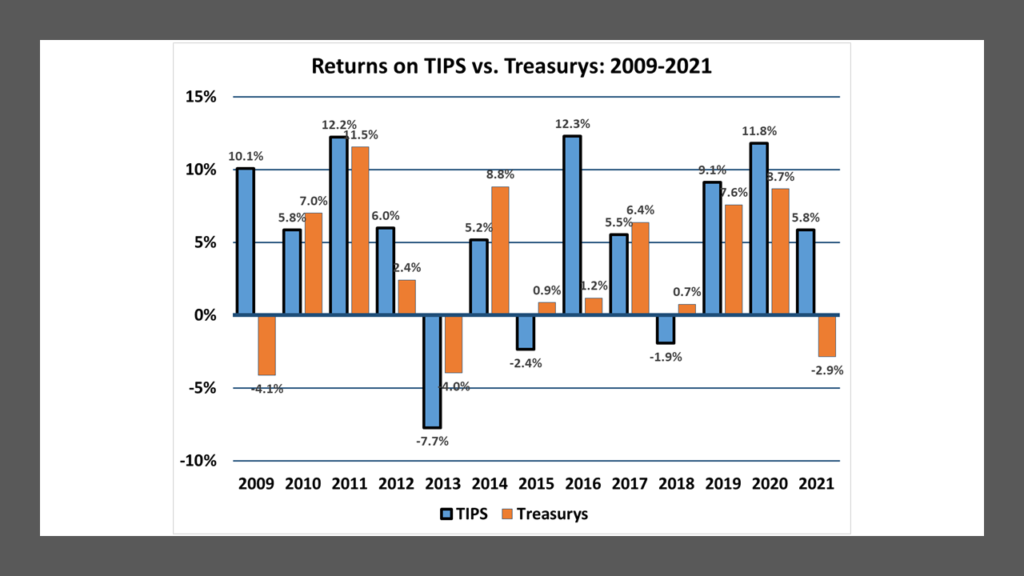
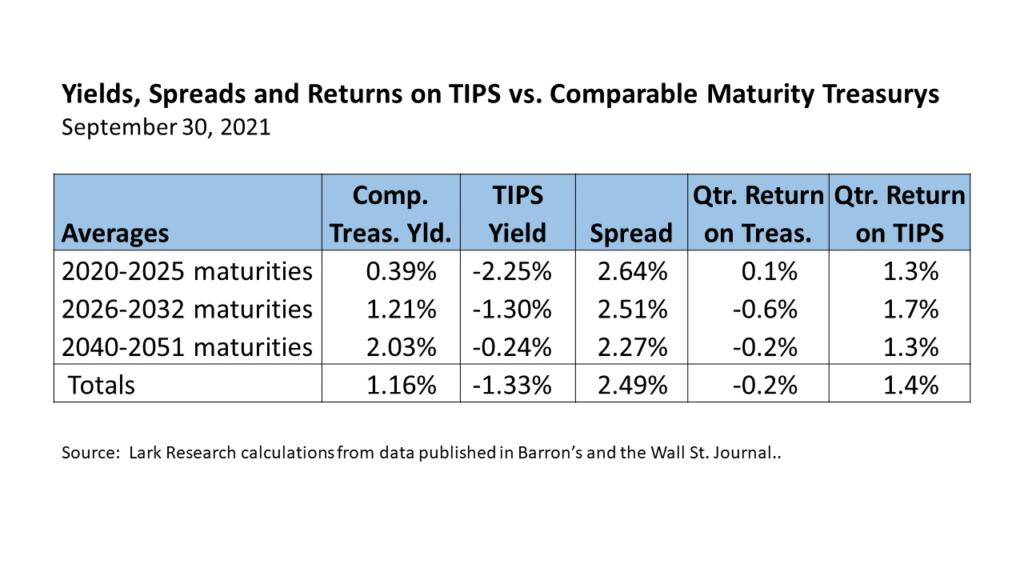
Treasury Inflation-Adjusted Securities posted a 2.8% average return compared with a gain of 0.6% in comparable maturity straight Treasury securities in the 2021 fourth quarter. The returns on TIPS were especially strong across the longer maturities, as were the returns on straight Treasurys. The return on TIPS was driven by estimated price appreciation of 1.8% and a 1.3% gain from the CPI inflation adjustment, partially offset by the negative interest of -0.3%. Returns on comparable maturity straight Treasurys were again somewhat volatile across maturities, with a 0.7% loss in the short maturities, a 0.0% return in intermediates and a gain of 3.2% on the long end. The average TIPS yield ended the quarter at -1.62%, down 29 basis points (bp) from -1.33% at the end of the third quarter. Average straight Treasury yields ended the quarter at 1.27%, up 11 bp from 1.16% in 21Q3. The decrease in TIPS yields combined with the increase in Treasury yields increased the breakeven spread to another record high of 289 bp at Dec. 31 from 249 bp at Sept. 30. Thus, TIPS investors were more concerned about the outlook for inflation at the end of the year, compared with three months ago. TIPS have now outperformed straight Treasurys for seven consecutive quarters and for three consecutive years.
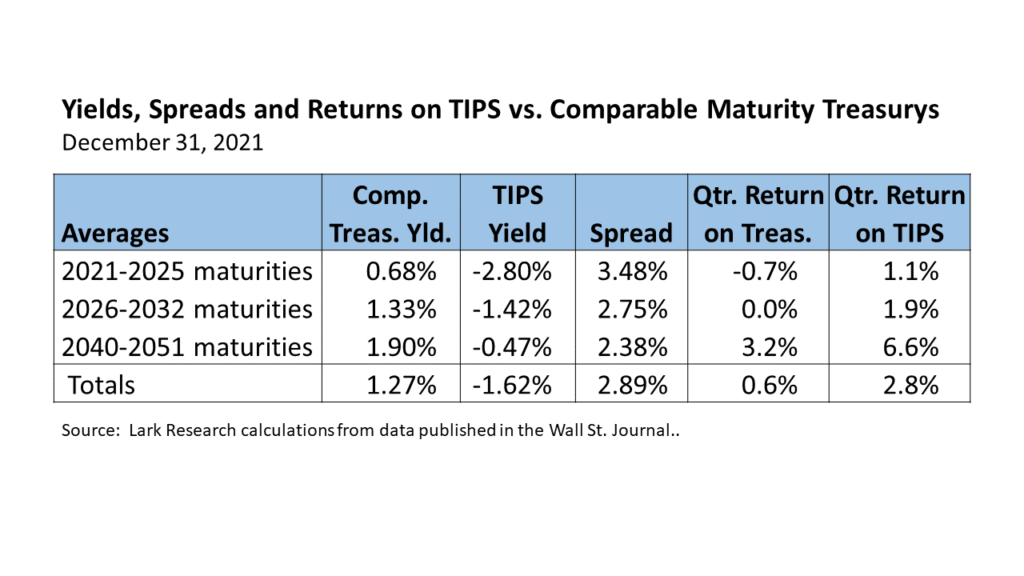
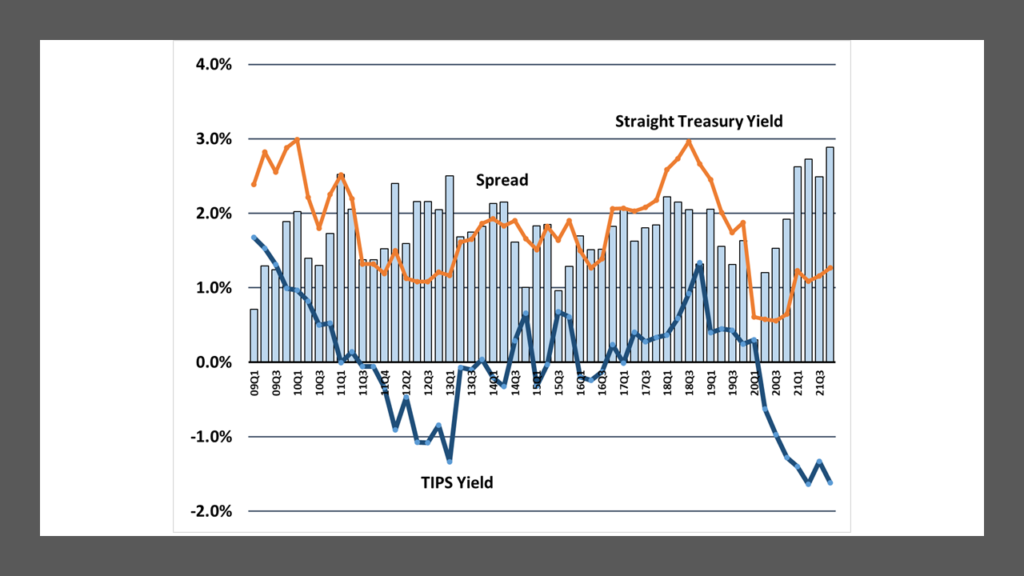
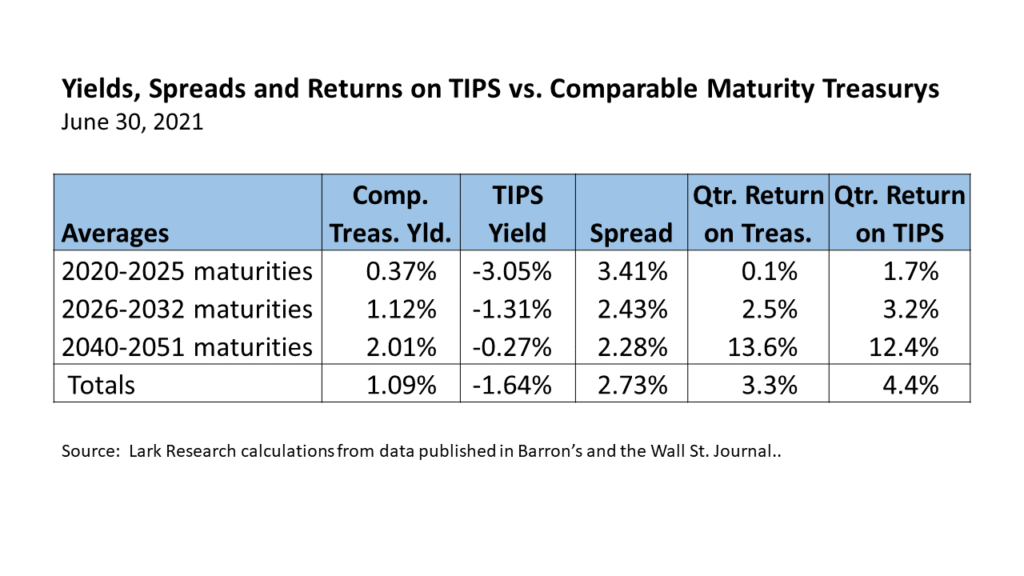
The strong 21Q4 performance in TIPS, along with the associated decline in TIPS yields, was a “head fake” by the TIPS market from the 2021 third quarter. During the third quarter, returns and yields on TIPS had moderated compared with the second quarter. TIPS yields had actually increased by 31 bp in 21Q3 from 21Q2 (i.e. they became less negative), which I took as a sign that concerns about inflation might be fading. Instead, the concerns about inflation boiled up again in the fourth quarter. The average TIPS yield ended 21Q4 at ‑1.62%, only slightly below the 21Q2 level of -1.64%. Thus, the TIPS yield curve downshifted again across all maturities, as shown on the next page.

The downshifting of the TIPS yield curve contrasts with the upshifting of the Treasury yield curve (except across the long maturities) in 21Q4. Straight Treasury yields rose by 29 bp across the short maturities and 12 bp across intermediates, but declined by 13 bp across the long maturities in 21Q4. The straight Treasury market appeared to reflect both the concerns about inflation and the prospect of the Federal Reserve beginning the process of curtailing its extraordinary monetary accommodation by reducing its purchases of Treasury and Agency securities and beginning to raise interest rates later this year.
While it is difficult to draw conclusions from one quarter’s results, it is worth noting that long-term yields for both TIPS and Treasurys declined in 21Q4. That inconsistency is difficult to explain. The breakeven yield across longer maturities increased by 11 bp to 2.38%, suggesting greater inflation expectations; but the real yield became more negative, suggesting investor complacency.

The decline in TIPS yields and rise in Treasury yields drove a 40 bp increase in the breakeven spread to 289 bp, the third record high in breakeven spreads recorded this year.
The increase in breakeven yields and strong performance in TIPS came despite the decline in the quarterly interest rate adjustment from 2.2% in 21Q3 to 1.3% in 21Q4. The fourth quarter adjustment is still elevated compared with the five-year average, as can be seen in the chart below:
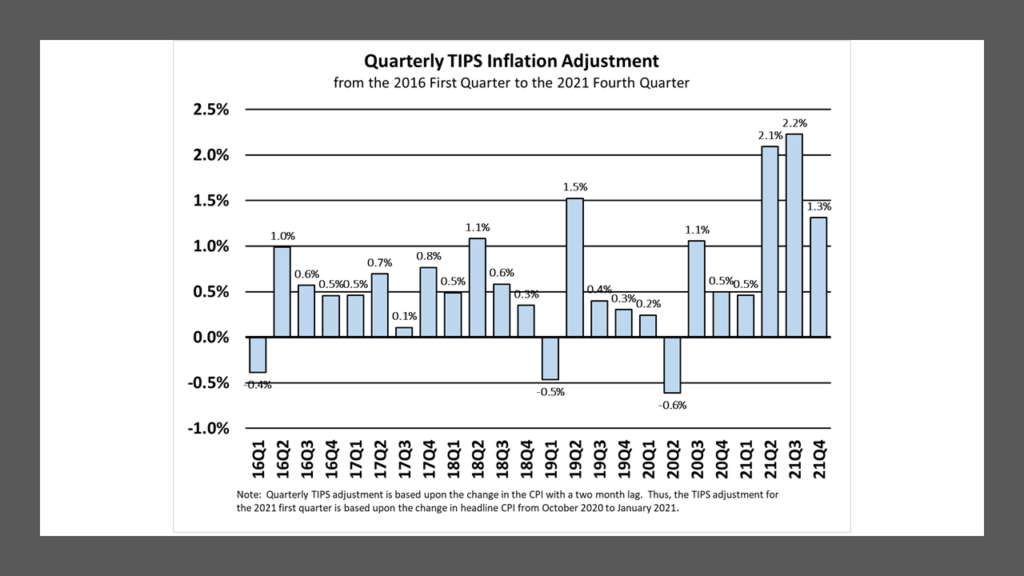
The 7.04% year-over-year increase in December’s headline CPI was front page news. It is due to several factors, including soaring house prices and rental rates, supply chain disruptions, labor shortages and higher energy prices. Even so, the December year-over-year increase reflects changes in the CPI throughout the course of the year. The increase in the CPI from November to December was 0.31%, the third smallest monthly increase this year.
There is evidence that some of the factors that have contributed to the high rate of inflation this year have begun to recede. With two months already in, it is likely that the CPI adjustment for 22Q1 will be lower than 21Q4, perhaps as low as 1%, which is still high, but below the adjustments recorded over the past three quarters.
Although the prices of oil and natural gas have rebounded in recent weeks, they are still below their October peaks. Flat prices, if sustained, would reduce inflation.
There is also anecdotal evidence of a cooling in house price inflation, even though the year-over-year increases reported in indices such as Case-Shiller have been eye-popping. Mortgage rates have risen recently to 3.45%, well above the average rate of 2.96% for 2021 that helped stoke the demand for housing. With the change in FOMC monetary policy, it is more likely that mortgage rates will remain at or near the current level, which should help slow the pace of price increases in 2022.
Although there have been mixed reports, it does appear that supply chain disruptions will ease during the course of 2022. With the holiday season now passed, ports will likely begin to catch up on their backlogs. The expiration of the child tax credit should also bring more people back to work, especially as the Omicron variant recedes.
I am not trying to minimize long-term concerns about inflation. Given the enormous monetary and fiscal stimulus that has been mostly debt financed, avoiding a significant pick-up inflation could prove to be quite challenging in the long-run.
However, it seems to me in the short run that the case for an easing in inflation during the course of 2022 is much stronger today than at any time in the past 12 months. Even though the TIPS market gave us that head-fake in 21Q4, I think that barring unforeseen events it is more likely now that TIPS will underperform Treasurys over the next few quarters and possibly beyond.
January 14, 2022
Stephen P. Percoco
Lark Research
839 Dewitt Street
Linden, New Jersey 07036
(908) 975-0250
admin@larkresearch.com
© 2015-2025 by Stephen P. Percoco, Lark Research. All rights reserved.
This blog post (as with all posts on this website) represents the opinion of Lark Research based upon its own independent research and supporting information obtained from various sources. Although Lark Research believes these sources to be reliable, it has not independently confirmed their accuracy. Consequently, this blog post may contain errors and omissions. Furthermore, this blog post is a summary of a recent report published on this subject and that report provides a more complete discussion and assessment of the risks and opportunities of any investment securities discussed herein. No representation or warranty is expressed or implied by the publication of this blog post. This blog post is for informational purposes only and shall not be construed as investment advice that meets the specific needs of any investor. Investors should, in consultation with their financial advisers, determine the suitability of the post’s recommendations, if any, to their own specific circumstances. Lark Research is not registered as an investment adviser with the Securities and Exchange Commission, pursuant to exemptions provided in the Investment Company Act of 1940. This blog post remains the property of Lark Research and may not be reproduced, copied or similarly disseminated, in whole or in part, without its prior written consent.