TIPS Adjust to the Financial Market Environment
U.S. Treasury Inflation-Protected Securities had a solid year in 2014, bouncing back from losses in 2013. Yet, except for the losses in 2013, TIPS returns were the lowest since 2008.
According to my calculations, TIPS produced a total return of 5.15% in 2014, which was below the total estimated 8.81% return on comparable maturity U.S. Treasurys. By comparison, 2014 was the best year for U.S. straight Treasury securities since 2011. Returns for both TIPS and Treasurys for the 2009-2014 period are shown in the following chart:

The negative return for TIPS in 2013 was the result of a horrible 2013 second quarter, which has come to be known as the taper tantrum. Back then, all Treasury bonds sold off in response to then Fed Chairman Bernanke’s statements that the Federal Reserve would wind down its Quantitative Easing program. The Fed’s QE program officially ended on October 29, 2014.
Despite the market’s fears, interest rates have not moved nearly as high as the market feared and in fact, have declined throughout the course of 2014 and into 2015. After rising to a peak of 3.01% at the beginning of 2014, the yield on the 10-year Treasury has fallen steadily throughout the course of 2014 and currently sits below 2.00%.
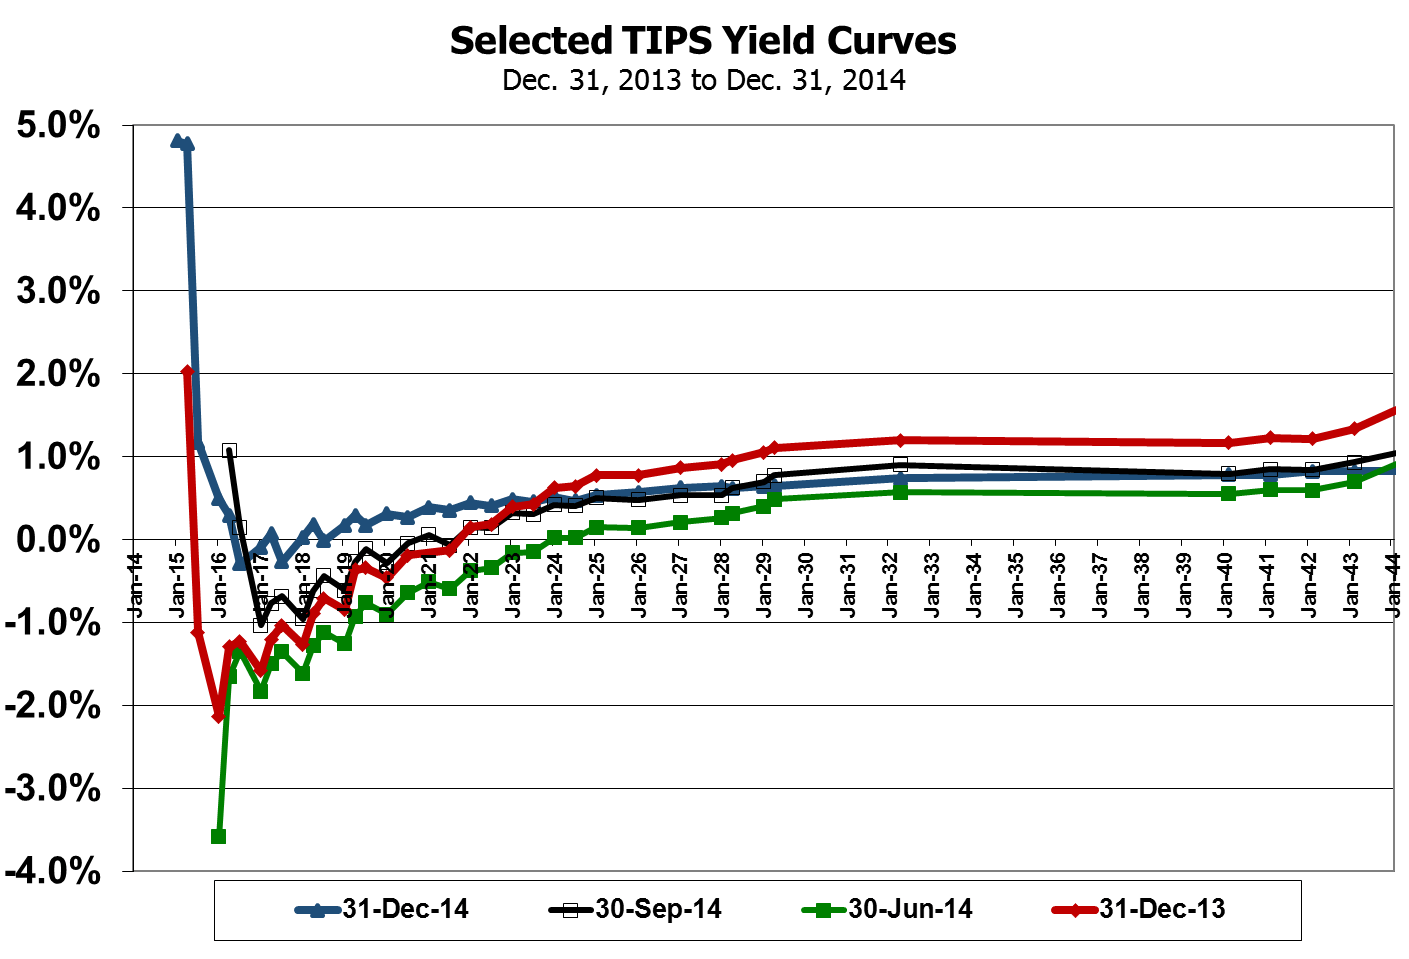
While 2014 was consistently good year for straight Treasurys throughout the year, it was a surprisingly volatile year for TIPS, as shown in the chart below:

That volatility was driven primarily by two factors: the change in the quarter-to-quarter consumer price index (CPI) and also by the rise in short-term TIPS yields.
Returns on TIPS are driven by changes in yield and by inflation as measured by headline CPI. The change in CPI is added to TIPS principal. In the first half of 2014, the change in the CPI was decidedly positive, as shown in the following chart:

In the first half of 2014, energy was a positive contributor to the increase in CPI, due to the rise in the spot price of West Texas Intermediate from $91 per barrel in early January to $108 per barrel in early June. As a result, second quarterly headline CPI increased 0.87%, a relatively strong showing in recent years. That increase in headline CPI helped fuel a 4.4% gain for TIPS in the 2014 second quarter, which was the best quarterly return for TIPS since I began tracking the TIPS market at the beginning of 2009.
As the price of oil began to fall in June and throughout the second half of 2014, however, the quarter-to-quarter percent change in headline CPI turned negative. In the 2014 third quarter, headline CPI declined by 0.025%. Through November 2014, fourth quarter headline CPI was down 0.253%. CPI for the full 2014 fourth quarter will be reported on January 16.
Besides the impact of the CPI, TIPS returns are also affected by changes in yields. Several points are noteworthy about these changes in 2014. First, long-term TIPS yields have continued to decline, roughly in line with Treasurys. I calculate that long-term TIPS (i.e. those maturing from 2026 to 2044) produced a total return of 14.6% in 2014, compared with an average total return on comparable maturity Treasurys of 19.4%.
At the same time, average yields on short-term TIPS (i.e. those maturing from 2015 to 2018) have risen sharply since the second quarter from -1.47% to +0.93%. As a result, the strong gain on short-term TIPs in the second quarter swung to quarterly losses exceeding 1.0% in the 2014 third and fourth quarters. In fact, the third and fourth quarter losses were the two worst since 2009 and the first time in that six-year stretch that losses on short-term TIPS exceeded 1.0%. With the drop in oil prices, investors apparently do not see much prospect for a positive benefit from the CPI and so they have become unwilling to continue to accept negative yields in short-term TIPS.

The negative returns on short-term TIPS in 2014 were the worst since I have been tracking the sector and average yields across all short-term maturities at the end of 2014 were the highest, as shown in the chart below:

Another noteworthy development in 2014 is the significant widening of bid-ask spreads. By my calculations, the average bid-ask spread for TIPS across all maturities increased by 78% from just over 1/8 point to just under 1/4 point. Bid-ask spreads widened the most across the short-term and especially the intermediate-term maturities, but less so across the longer maturities. The widening of spreads has accompanied increased volatility in TIPS prices this year. The widening of bid-ask spreads may also reflect less willingness on the part of broker-dealers to assume inventory risk for these securities. However, bid-ask spreads for straight U.S. Treasury securities remain very tight.
QUARTERLY TIPS VS. TREASURYS PERFORMANCE
First Quarter Performance

TIPS provided a total return of 2.35% in the 2014 first quarter, slightly below the average return on comparable maturities Treasurys. The average yield on TIPS decreased from 0.04% to -0.21%; while comparable maturity straight Treasury yields increased slightly from 1.86% to 1.93%. As a result, the average spread widened from 182 basis points (bp) to 213 bp.
Second Quarter Performance

As already noted, TIPS posted a very strong third quarter, with an average gain of 4.38%, better than the average gain of 2.23% on comparable maturity Treasurys. The gains on TIPS were driven in large part by positive gains in the CPI. The average TIPS yield declined again by 12 bp to -0.33%. Likewise, Treasury yields eased by 10 bp to 1.83%. Accordingly, the TIPS-Treasury spread widened by 2 bp to 215 bp.
Third Quarter Performance

Third quarter returns on TIPS were negative at 1.96%, worse than the 0.67% gain on comparable straight Treasurys. The negative returns resulted in part by falling headline CPI. The average TIPS yield rose from -0.33% to 0.29%, while average Treasury yields rose by 7 bp, with all of the increases coming in the short and intermediate maturities. With the sharp rise in TIPS yields, the average spread fell by 54 bp to 161 bp.
Fourth Quarter Performance

The average return on TIPS in the 2014 fourth quarter was 0.39%, which was not nearly as strong as the 3.16% on comparable maturity Treasurys. TIPS losses in the quarter were concentrated in the short- and intermediate-term maturities. Long-term TIPS posted gains, but not nearly as strong as comparable Treasurys. The potential for lower CPI increases as a result of the sharp drop in the price of oil undoubtedly influenced TIPS returns. The average TIPS yield increased by 37 bp to 66 bp, while the average Treasury yield fell by 24 bp to 1.66%. Consequently, the TIPS spread declined by 61 bp to only 100 bp, which was the lowest level since the 2009 first quarter.

Authors Note: My calculations of average yields and returns is for the universe of TIPS and comparable maturity Treasurys only and so may not be directly comparable to other total return calculations of the entire U.S. Treasury market. My average return calculations are also simple averages across maturities and are not weighted by securities amounts outstanding. In some cases, especially with newly issued TIPS, their annualized rates of returns in the year of issuance can be distorting (either unusually high or unusually low, especially in relation to other TIPS securities). Consequently, I may choose to leave the returns for those securities out of the calculations of average returns. On balance, however, I believe that my return and average yield calculations do track the overall returns for the TIPS and U.S. Treasury markets accurately and provide a useful indicator of performance for those following the TIPS market. Supporting figures and a more detailed calculation methodology are available upon request.
Originally published January 6, 2015
Stephen P. Percoco
Lark Research
16 W. Elizabeth Avenue, Suite 4
Linden, New Jersey 07036
(908) 975-0250
admin@larkresearch.com